IMAGE

Figure 3

ID
ZDB-IMAGE-200720-17
Genes
Source
Figures for Ong et al., 2020
Image
Figure Caption

Figure 3

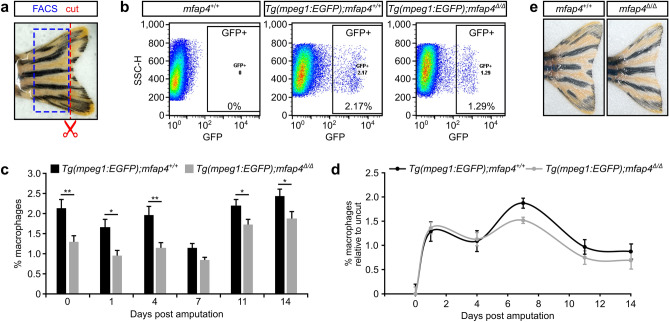
mfap4 mutant fish have reduced numbers of macrophages. (a) The adult tail fins of wild-type (WT, mfap4+/+) and mfap4∆/∆ mutant fish were amputated (red dotted line). Cells in the remaining part of the tail fin (blue dotted box) were dissociated and macrophage numbers quantitated by FACS using the Tg(mpeg1:EGFP) fluorescent reporter. (b) FACS analysis depicting side scatter (SSC) on the y-axis and Tg(mpeg1:EGFP) fluorescence on the x-axis. (c) Graphical representation of mean macrophage numbers of fifteen biological replicates per genotype [determined as in panel (b)] for various time points post amputation. At most analyzed time points, there are significantly fewer macrophages in mfap4∆/∆ tail fins as compared to the WT fins (0 days post amputation (dpa), P = 0.0043; 1 dpa, P = 0.0264; 4 dpa, P = 0.0049; 7 dpa, P = 0.0892; 11 dpa, P = 0.0235; 14 dpa, P = 0.0145; assessed by Mann–Whitney-U test). (d) Quantification of macrophage numbers in tail fins at the time points shown in (c) relative to uncut fins. There is no delay in the recruitment of macrophages. Error bars in (c) and (d) represent the standard error of the mean (s.e.m.) of biological replicates. (e) Representative images of regenerated WT and mfap4∆/∆ tail fins two months post amputation. Images in panel (b) were generated with FlowJo V10 software (FlowJo LLC). Graphs in panels (c) and (d) were generated with Microsoft Excel (for Mac 2011, version 14.7.7). This figure was created with Inkscape software version 0.92 (available at https://www.inkscape.org/).

Figure Data
Acknowledgments
This image is the copyrighted work of the attributed author or publisher, and ZFIN has permission only to display this image to its users. Additional permissions should be obtained from the applicable author or publisher of the image. Full text @ Sci. Rep.