
|
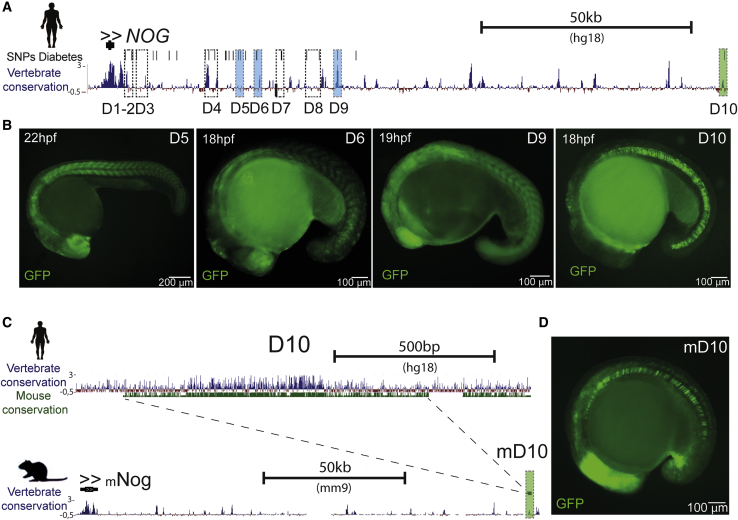
Figure 5
The Expression of
(A) Genomic landscape of human
(B) Representative images of GFP reporter lines for enhancers D5, D6, D9, and D10 (see also
(C) Genomic landscape of the human D10 sequence, showing vertebrate (blue track) and mouse conservation (green track) (above). Genomic landscape of mouse
(D) Representative image of the GFP reporter line for the mouse enhancer mD10. Scale bar represents 100 μm.