
|
Figure 1
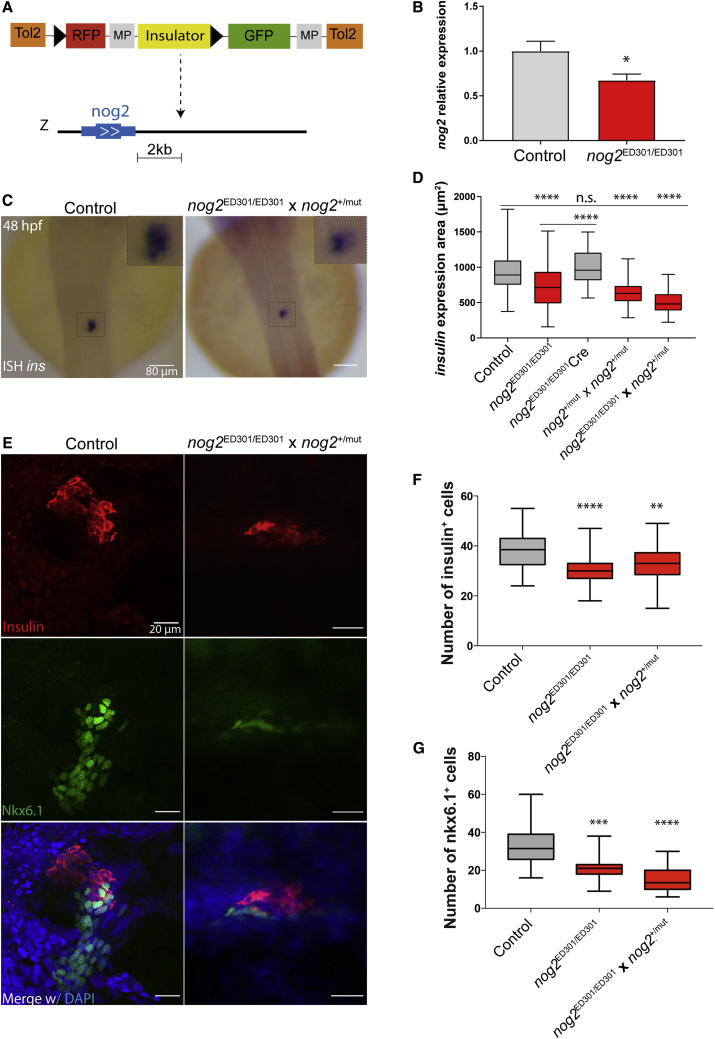
nog2 Is Required for Proper Pancreas Development
(A) ED301 zebrafish line corresponds to an ED transposon integration containing a potent enhancer blocking insulator (yellow) and mapped 2 kb downstream of
(B) In the ED301 zebrafish line,
(C)
(D) Quantification of the insulin expression area detected by
(E) Representative confocal images of 48 hpf zebrafish embryos counterstained with a DAPI nuclear marker (blue), an anti-insulin antibody marking β cells (red), and an anti-Nkx6.1 antibody marking pancreatic progenitor cells (green). Images represent the maximum-intensity z projection of several focal planes obtained in a Leica Sp5 confocal microscope using a 40× objective. Scale bars represent 20 μm.
(F) Quantification of the number of insulin-expressing cells in nog2ED301/ED301 and nog2ED301/ED301, nog2+/mut outcross embryos compared with controls (n ≥ 30). Error bars represent SD; ∗∗∗∗p < 0.0001, ∗∗p < 0.01.
(G) Quantification of the number of nkx6.1-expressing cells in nog2 ED301/ED301 and nog2ED301/ED301, nog2+/mut outcross embryos compared with controls (n ≥ 18). Error bars represent SD; ∗∗∗∗p < 0.0001, ∗∗∗p < 0.001.