
|
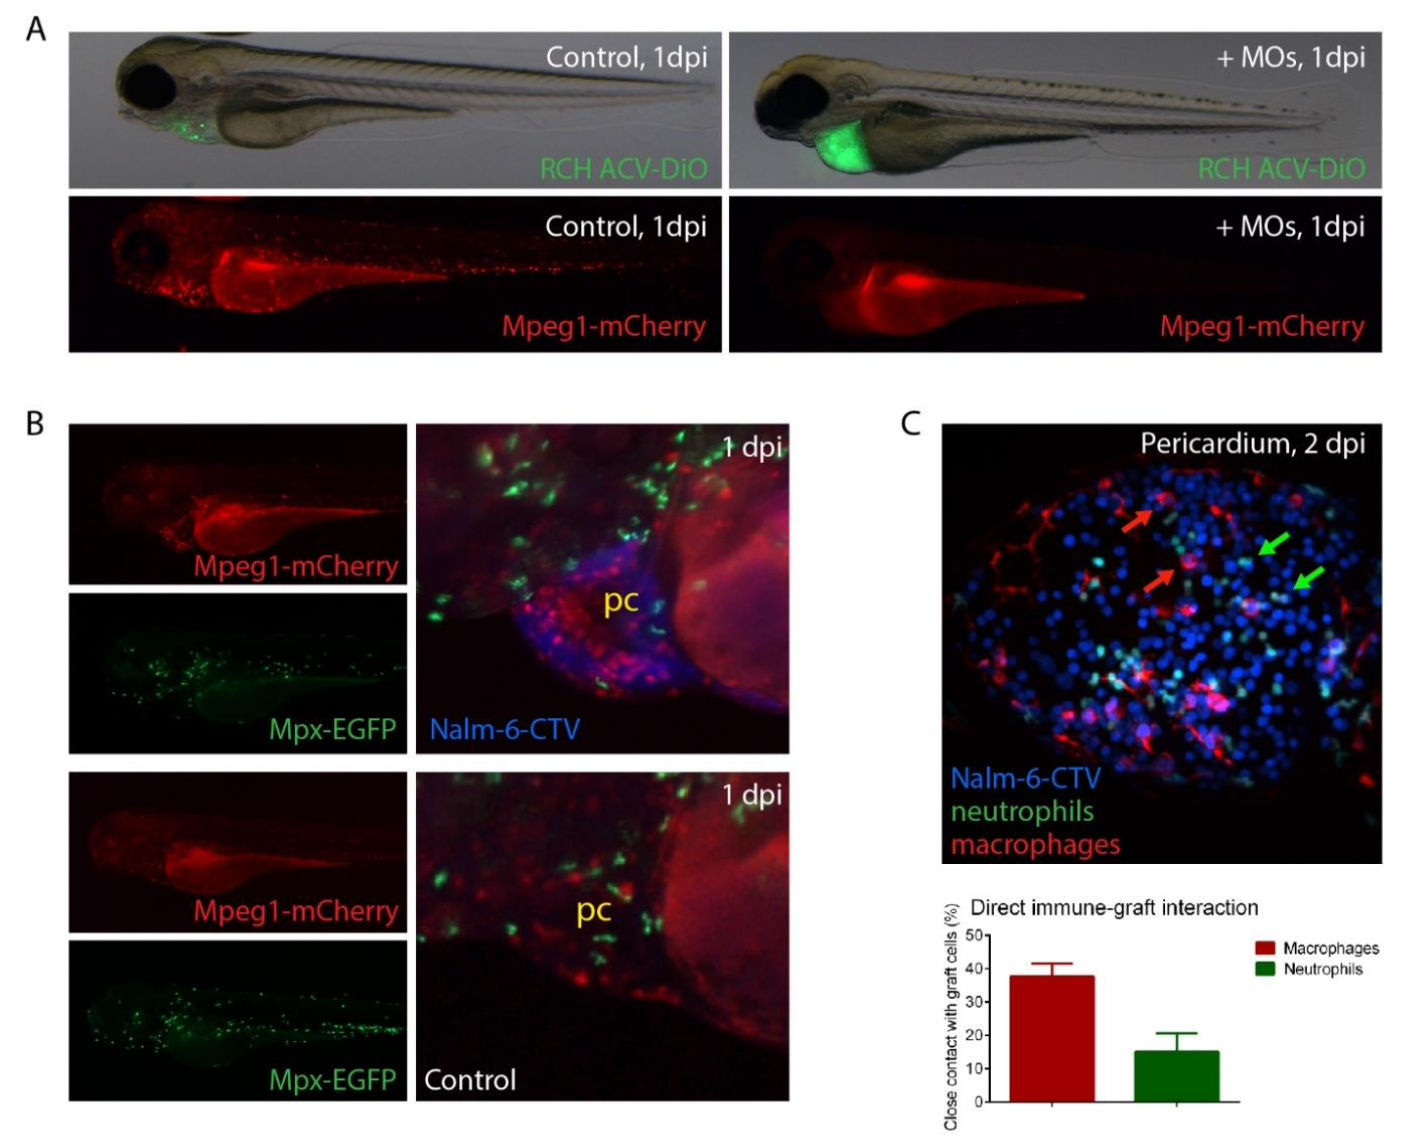
Fig. S4
Host macrophages and neutrophils interact differently with ALL xenografts at the injection site. A. Morpholinos (MOs) against spi1/csf3r were injected into fertilized eggs of the tg(mpeg1- mCherry) reporter zebrafish line (red signal) to suppress macrophage development. Both embryos were transplanted with DiO labelled RCH-ACV cells (green signal) at 2 days post-fertilization. Green signal shows graft expansion at 3 days post-fertilization in the immunosuppressed fish (right) compared to the uninjected control (left). Single red cells are macrophages present in the control (left) but absent in the immunosuppressed embryo (right). B. Fluorescent images of double transgenic, live embryos with fluorescent macrophages (red, mpeg1-mCherry) and neutrophils (green, mpx-EGFP) represented as single channels or merge with engrafted CTV-labeled Nalm-6 cells (blue) into the pericardium (pc) or control without graft. Caudal is to the right and ventral to the bottom, all zebrafish embryos shown are not transiently immunosuppressed. C. Merged fluorescent high-resolution image of pericardium (ventral view) of a double-transgenic, live embryo as shown in B, engrafted with CTV- labeled Nalm-6 cells 2dpi. Arrows indicate macrophages (red) and neutrophils (green) in close contact with graft cells (blue). Bars indicate mean (n = 8) percentage of macrophages and neutrophils present at the graft site that interact closely with Nalm-6 cells at 2dpi. Error bars represent SEM.