
|
Fig. 3
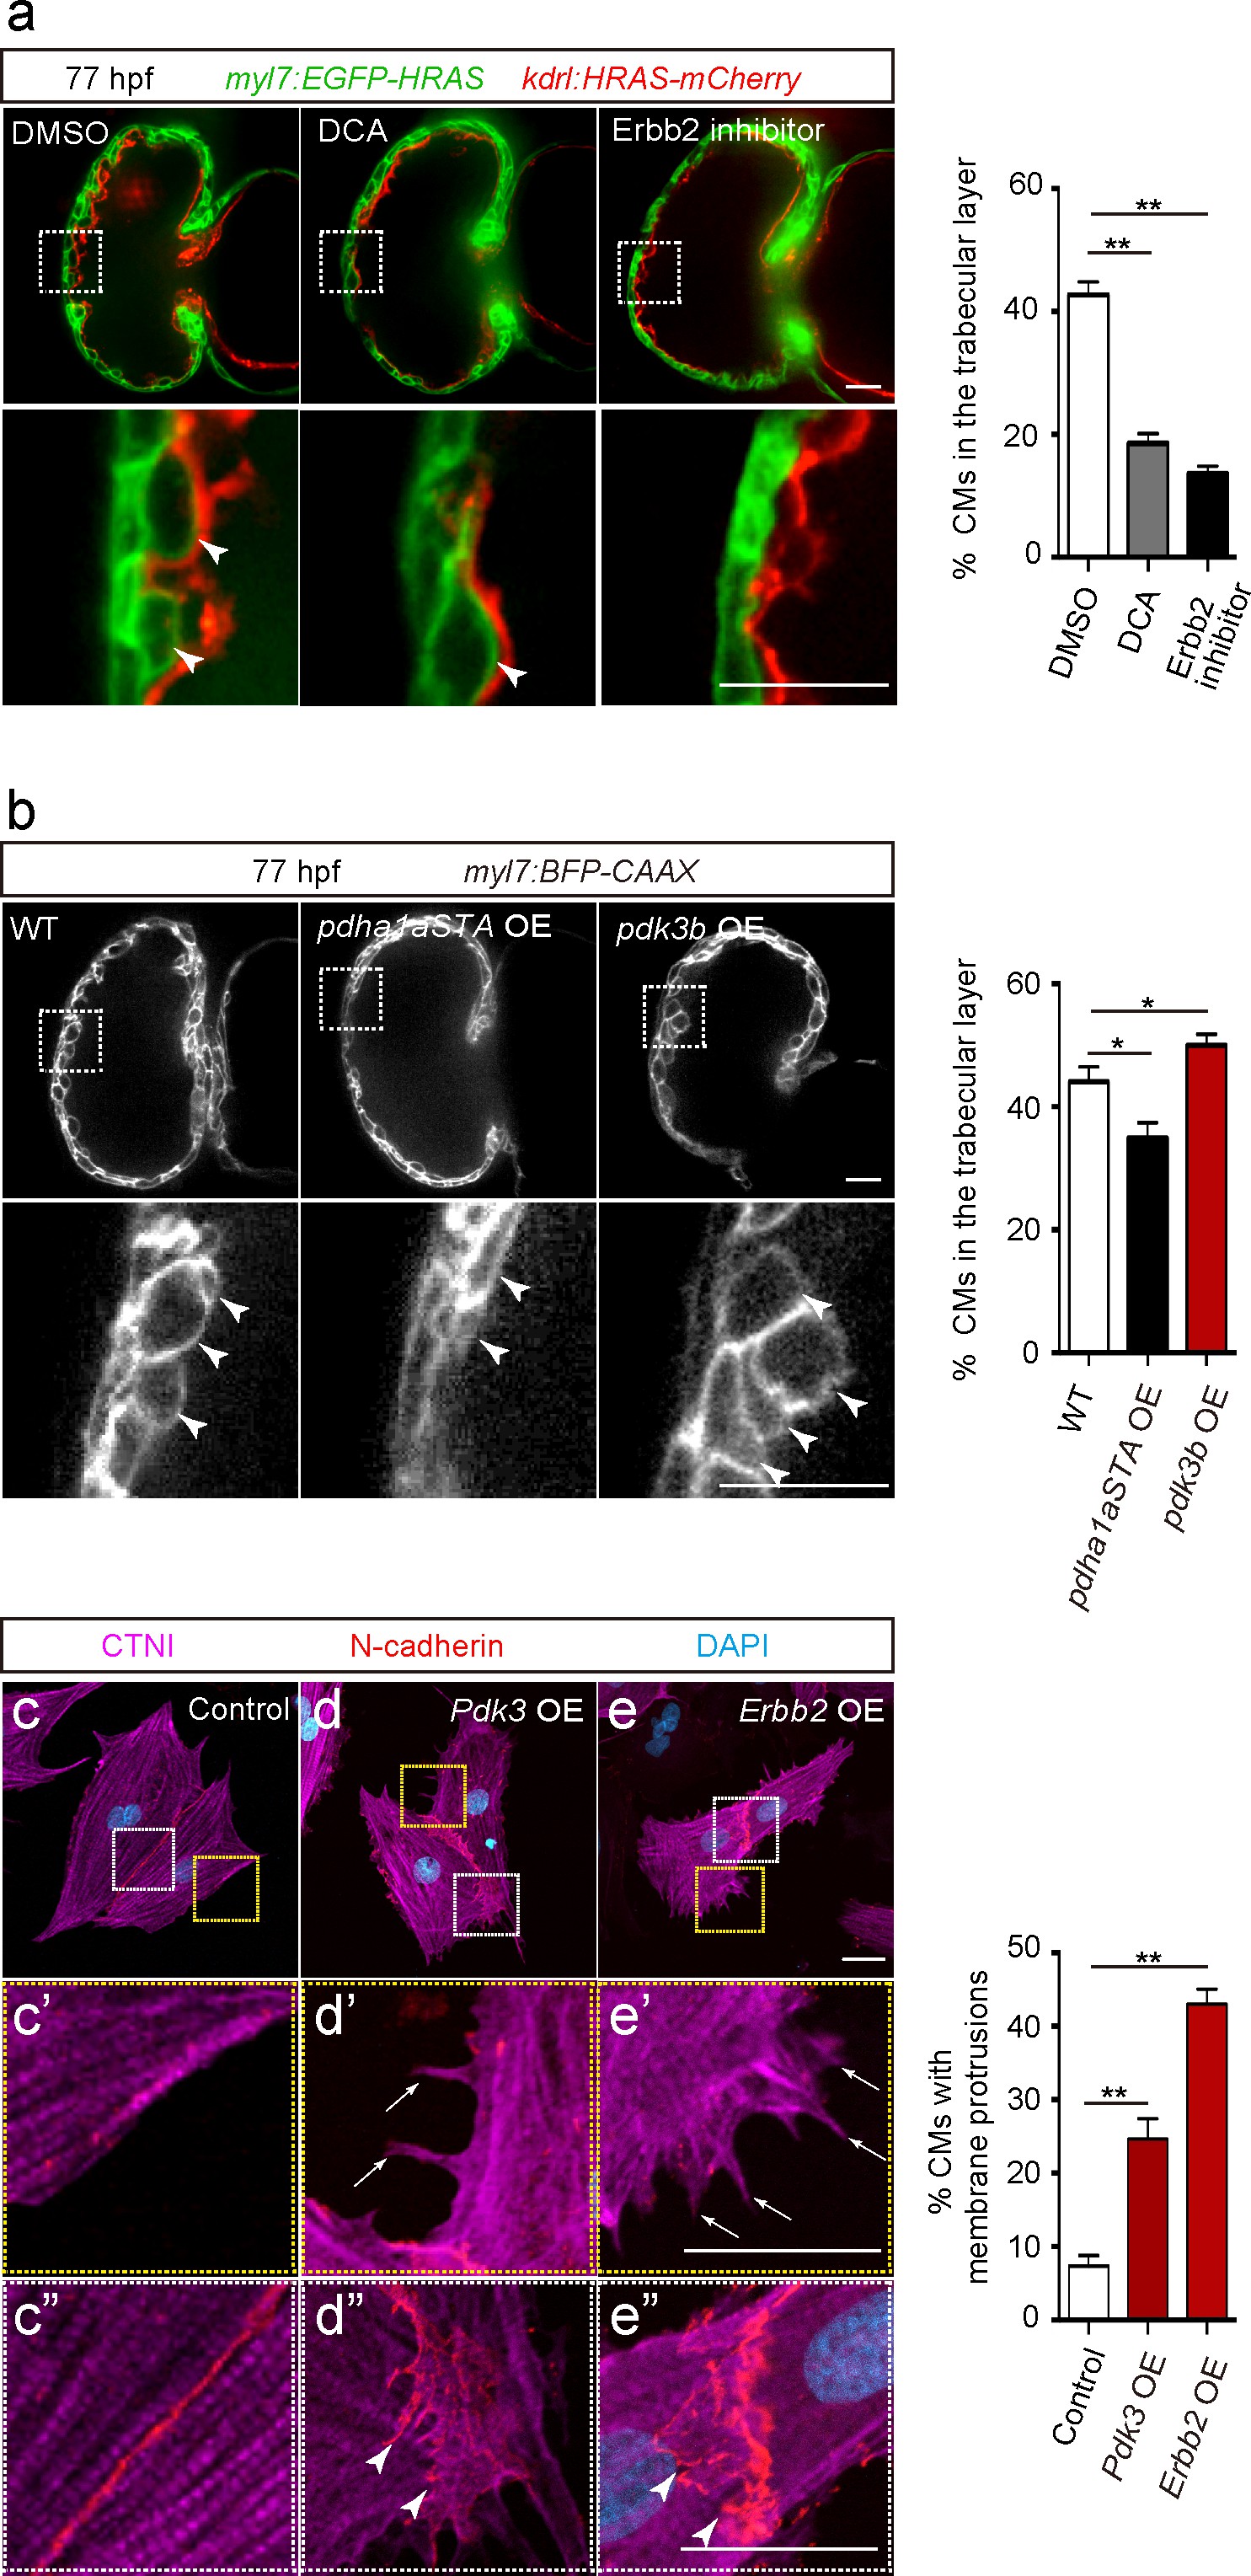
Glycolysis regulates cardiac trabeculation.
(a) Confocal images (mid-sagittal sections) of 77 hpf hearts treated with DMSO, dichloroacetate (DCA) or Erbb2 inhibitor; magnified view of area in white boxes shown below; arrowheads point to CMs in the trabecular layer; percentage of CMs in the trabecular layer shown on the right (n = 5–7 ventricles). (b) Confocal images (mid-sagittal sections) of 77 hpf Tg(myl7:BFP-CAAX) alone or in combination with Tg(myl7:pdha1aSTA-P2A-tdTomato) or Tg(myl7:pdk3b-P2A-tdTomato) hearts; magnified view of area in white boxes shown below; arrowheads point to CMs in the trabecular layer; percentage of CMs in the trabecular layer shown on the right (n = 5–7 ventricles). (c–e”) Staining for CTNI, N-cadherin and DNA (DAPI) in control (c), Pdk3 (d) and Erbb2 (e) OE rat neonatal CMs; magnified view of area in yellow (c’, d’, e’) and white (c”, d”, e”) boxes; percentage of CMs exhibiting membrane protrusions shown on the right (n = 3 individual experiments; each value corresponds to an average of 30 CMs). Pdk3 and Erbb2 OE causes rat neonatal CMs to exhibit membrane protrusions (d’, e’; arrows) and cell-cell junction rearrangements (d’, e’; arrowheads). Error bars, s.e.m.; *p<0.05 and **p<0.001 by ANOVA followed by Tukey’s HSD test. Scale bars, 20 μm.