
|
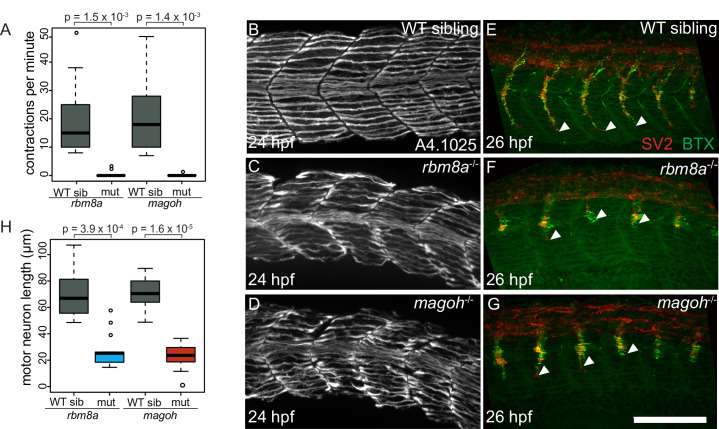
Fig 3
A. Boxplots showing the number of spontaneous contractions per minute measured for the EJC mutant embryos and WT siblings at 24 hpf as indicated on the x-axis. Welch’s t-test p-values are indicated at the top. B-D. Immunofluorescence images showing Myh1 expression in somites 10–14 of WT sibling (B)