
|
Fig 7
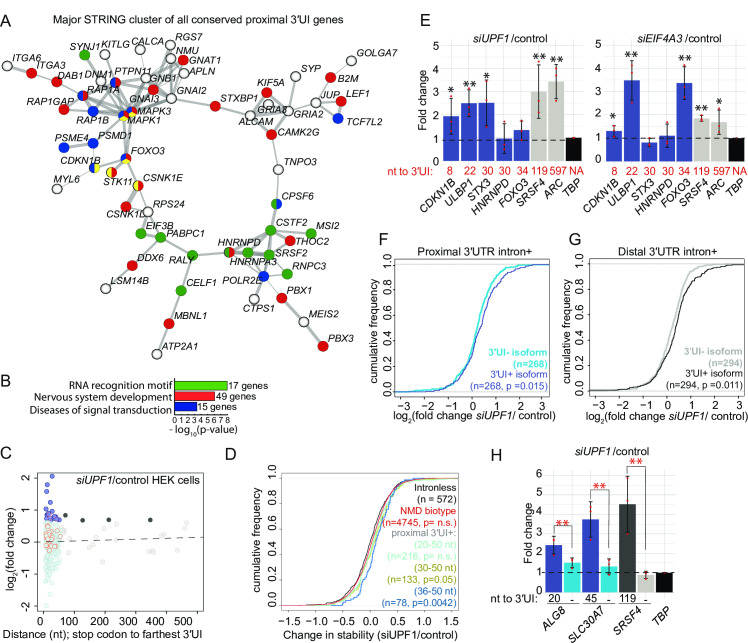
A. A major interaction cluster predicted by STRING network analysis of genes with a 3′UI in proximal position in zebrafish, mouse and human. Nodes are colored by gene/protein function: nervous system (red), presence of RNA recognition motif (RRM) (green), diseases of signal transduction (blue), FoxO signaling pathway (yellow). (167 nodes and 127 edges in total, PPI enrichment p-value = 0.02). B. Gene ontology enrichment analysis of all 167 genes with conserved 3′UI proximal positioning. The most significant GO term within the following functional categories are shown: Interpro domains, Biological process and Reactome pathways. C. A scatter plot showing fold changes for APPRIS-annotated proximal 3′UI transcripts (dark blue: FC > 1.5 and light blue: FC < 1.5) and distal 3′UI transcripts (black: FC > 1.5 and gray: FC < 1.5) in