IMAGE

Fig. 2

ID
ZDB-IMAGE-200619-38
Source
Figures for Sun et al., 2020
Image
Figure Caption

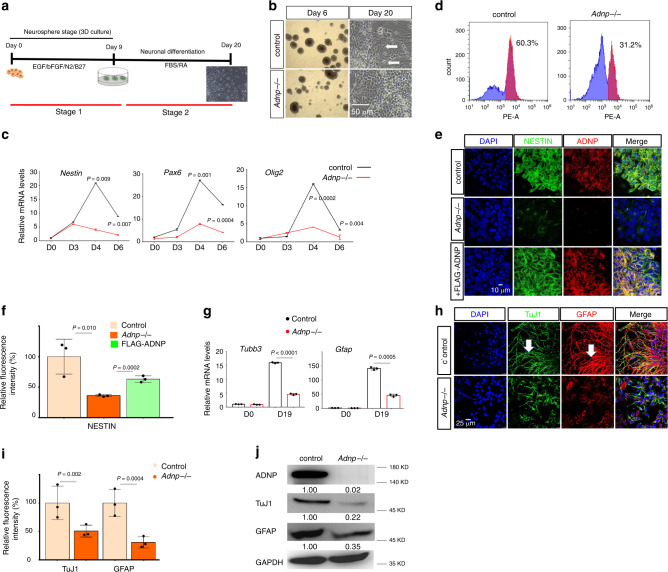
Fig. 2 ADNP is required for proper ESC neural differentiation.

a Cartoon showing the two-Stage ESC neural differentiation protocol. b Representative image showing morphology of day 6 and day 20 control and Adnp−/− ESC-derived neurospheres and neuronal cultures from three independent experiments with similar results. The white arrows pointing to the fiber-like neuronal structures. c The dynamic expression profile of representative neuroectodermal genes during control and Adnp−/− ESC neural induction. d Flow cytometry analysis for quantification of PAX6+ cells. Blue: isotype control; purple: experimental group using PAX6 antibody. e IF staining of neural progenitor marker NESTIN and ADNP for control, Adnp−/− ESC and FLAG-ADNP restoring Adnp−/− ESC-derived day 6 NPCs. Representative image from 3 to 5 random microscopic fields of three independent experiments with similar results. f Quantification of mean fluorescence intensity of NESTIN staining using ImageJ software. FLAG-ADNP rescued the fluorescence intensity of NESTIN staining in Adnp−/− ESC-derived neurospheres. g qRT-PCR analysis for Tubb3 (encoding TuJ1) and Gfap for day 19 control and Adnp−/− ESC-derived neuronal cell cultures (n = 3 per group). h IF staining of neuronal marker TuJ1 and glial marker GFAP for day 19 control and Adnp−/− ESC-derived neuronal cell cultures. The white arrows showing the neuronal fiber structures. i Quantification of mean fluorescence intensity of TuJ1 and GFAP staining using ImageJ for panel (h). j WB analysis of TuJ1 and GFAP levels in day 19 control and Adnp−/− ESC-derived neuronal cell types. WB were repeated at least two times, and shown were the representative data. qRT-PCR was based on three biologically independent experiments in (c, g). Mean fluorescence intensity was calculated based on three biologically independent experiments (n = 3–5 different regions of interest per group) in (f, i). Data are presented as mean values ± SEM and p values by two-tailed unpaired t-test are shown in (c, f, g, i).

Acknowledgments
This image is the copyrighted work of the attributed author or publisher, and ZFIN has permission only to display this image to its users. Additional permissions should be obtained from the applicable author or publisher of the image. Full text @ Nat. Commun.