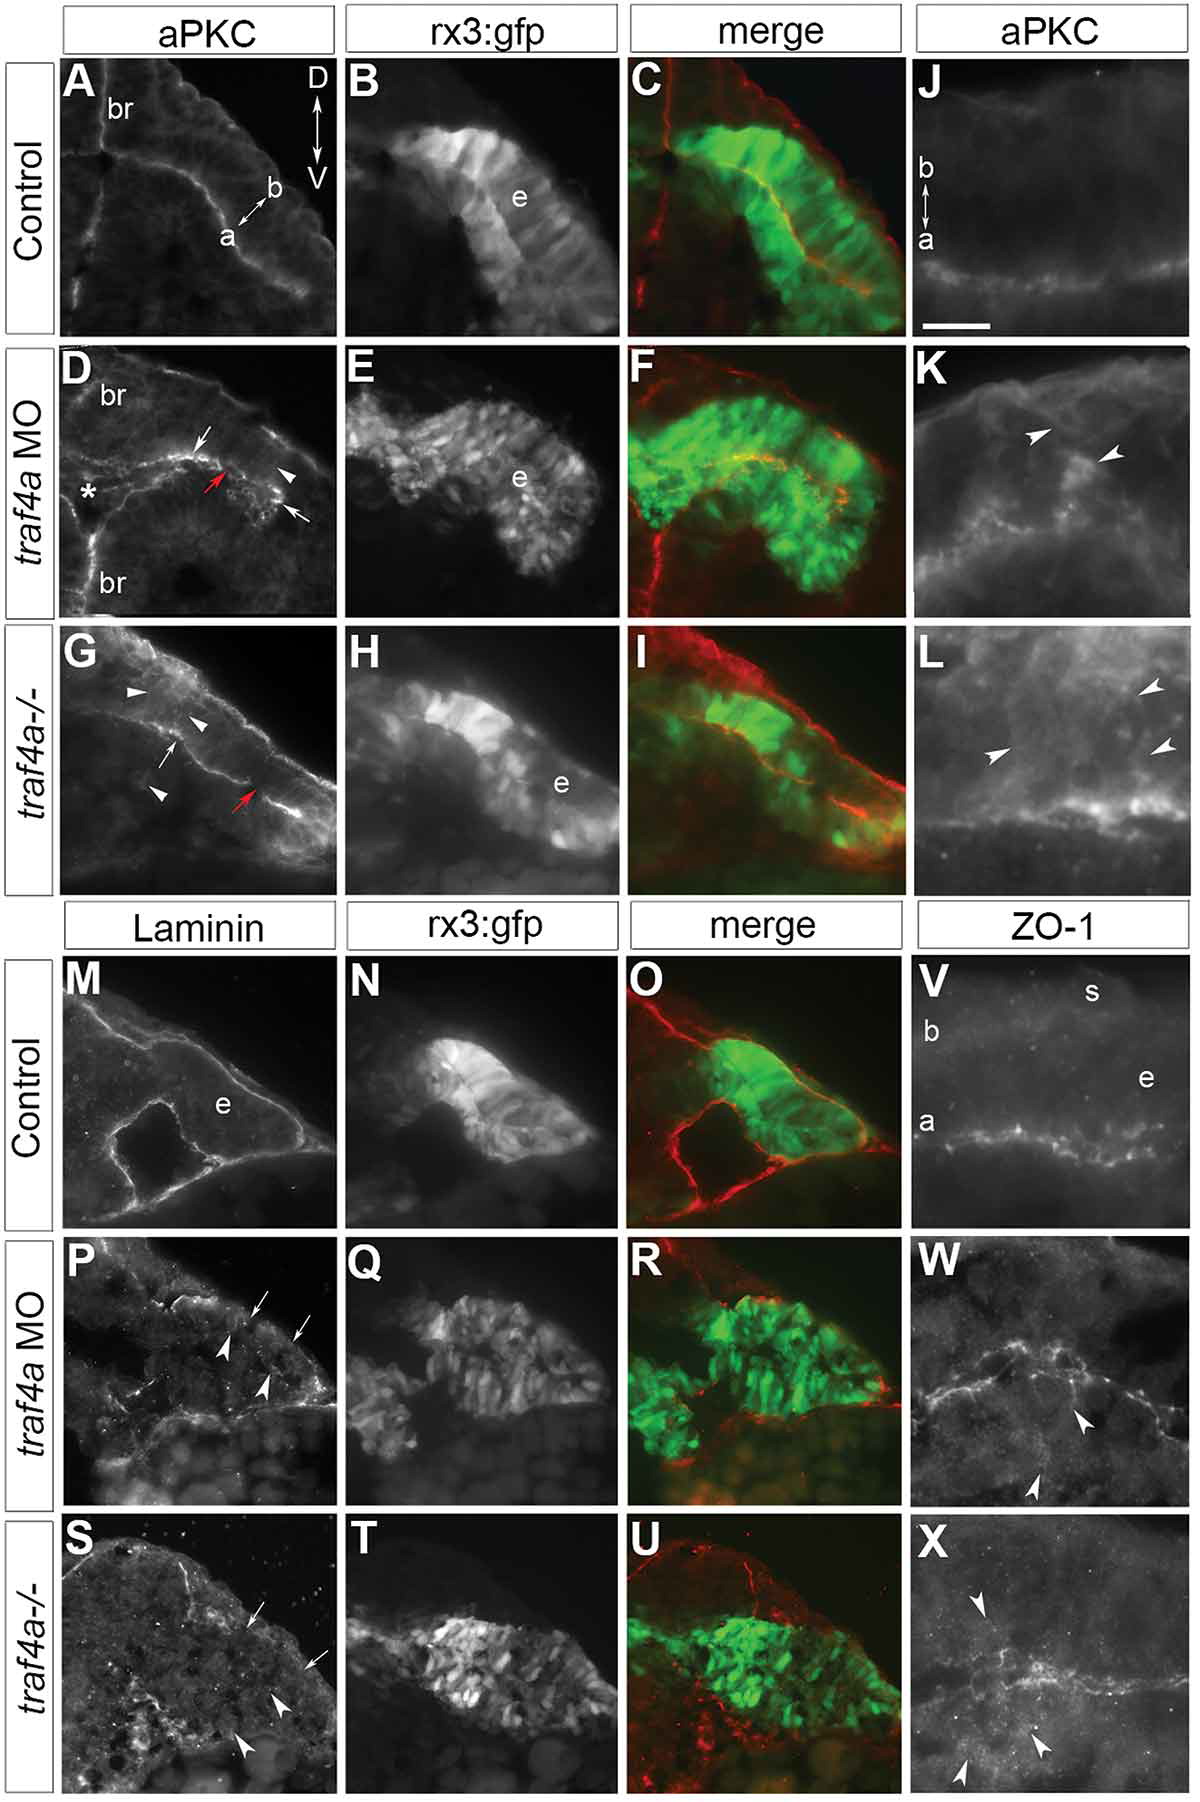
Fig. 7 Traf4a loss disrupts apical-basal polarity of the eye epithelium. Transverse sections through the anterior forebrain (br) and eye vesicles (e) of control (A-C,J,M-O,V), traf4a morphant (D-F,K,P-R,W), and traf4a-/- (G-I,L,S-U,X) 12-14ss Tg(rx3:GFP) embryos. A-L: aPKC (A,D,G,J-L) immunolabeling, and merge (C,F,I) with GFP (B,E,H). Unevenly distributed apical (D,G arrows), and patches of non-apically localized (D,G,K,L; arrowheads), aPKC immunolabel are evident with Traf4a loss. M-U: Laminin immunolabeling (M,P,S) is basally localized in control, but patchy (arrows) and occasionally ectopically expressed (arrowheads) in morphants and mutants. V-X: ZO-1 immunolabeling is predominantly at the apical surface of the eye epithelium, but is also ectopic to the apical surface (W,X; arrowheads) with Traf4a loss. Orientation in A applies to all panels. a, apical; b, basal; s, skin. Scale bar in J is 50 Ám (A-I), 75 Ám (M-U), and 20 Ám (J-L, V-X).
Image
Figure Caption
Figure Data
Acknowledgments
This image is the copyrighted work of the attributed author or publisher, and
ZFIN has permission only to display this image to its users.
Additional permissions should be obtained from the applicable author or publisher of the image.
Full text @ Cell Adh. Migr.

