
|
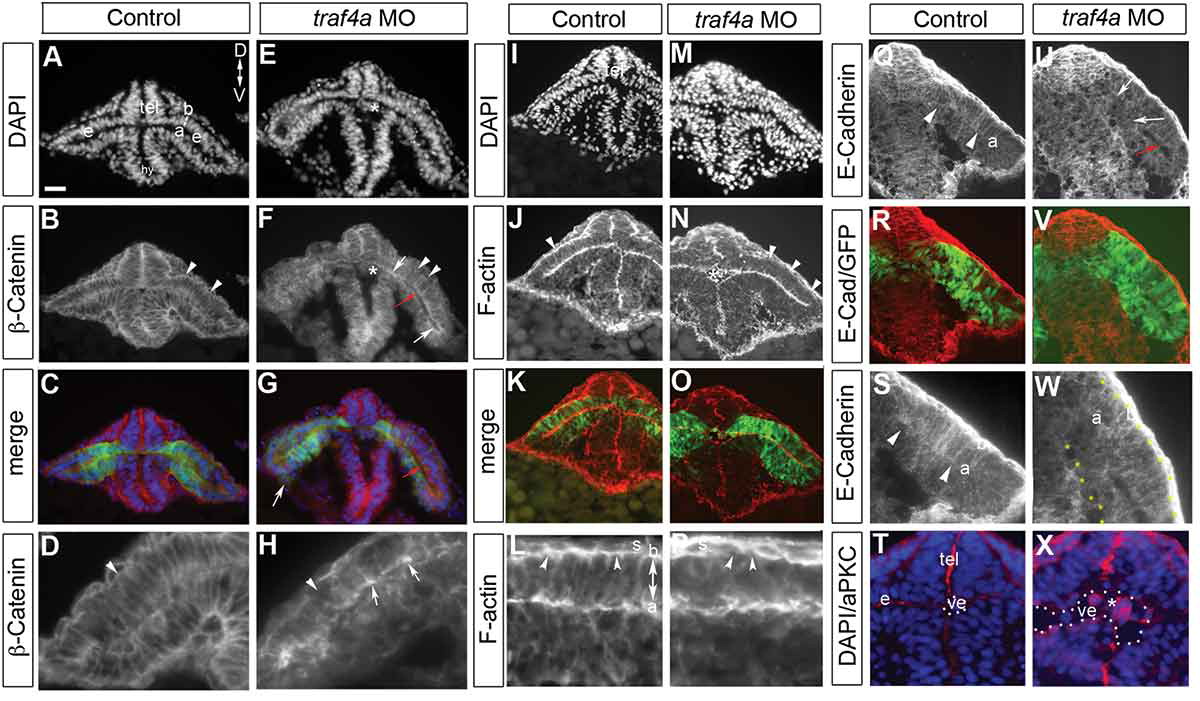
Fig. 4 traf4a knockdown disrupts apical adherens junction protein localization. Cryostat sections of 12 ss Tg(rx3:GFP) control (A-D,I-L,Q-T) and traf4a morphant (E-H,M-P,U-X) embryos labeled with antibodies for ?-Catenin (B,D,F,H), E-Cadherin (Q,U,S,W), and aPKC (T,X), and rhodamine-phalloidin to reveal F-actin (J-L,N-P). Shown is the merge with the corresponding GFP+ eye progenitors (C,G,K,O,S,W). High magnification views in D,H,L,P,S,T,W,X. Red arrows (F,G,U) point to open ventricle, and white arrow in G to a bulge off the eye vesicle. In morphants, ?-Catenin shows aberrant apical accumulations (F,H, white arrows), patches where the radial orientation of F-actin label evident in control (L) is lacking (P), and breaks in ?-Catenin and F-actin label basally (B,D,F,H,J,N,L,P arrowheads). E-Cadherin accumulation at the apical surface in control (Q,S arrowheads) is lost in morphant (U,W arrows). Of note, E-Cadherin is expressed at high levels in the skin epithelium (S). T,X: aPKC+ ectopic cells within the forebrain/eye vesicle ventricle (ve) in morphant (E,F,N,X asterisks) but not control (A,B,T). Orientation in A applies to all panels. Scale bar in A: 15 �m (L,P), 25 �m for D,H,S,T,W,X and 50 �m for remaining panels.