
Image
|
Figure Caption
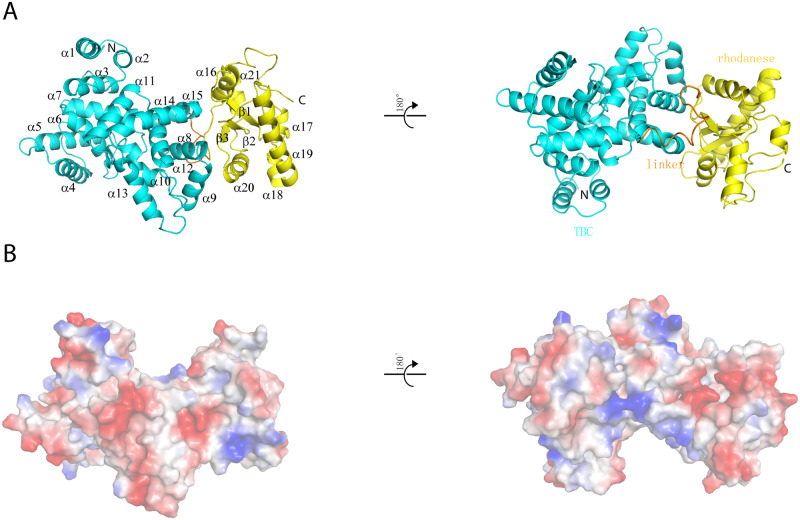
Fig 1
(A) Ribbon diagrams of D23N, shown in two orientations rotated 180° with respect to each other. Cyan: TBC domain; gold: linker; yellow: rhodanese domain. (B) Electrostatic surface potential map of D23N, shown in two orientations rotated 180° with respect to each other. Blue: positive; red: negative; white: neutral. The molecules are in the same orientations as those above them in (A). D23N, N-terminus of TBC1D23; TBC, Tre2-Bub2-Cdc16.
Acknowledgments
This image is the copyrighted work of the attributed author or publisher, and
ZFIN has permission only to display this image to its users.
Additional permissions should be obtained from the applicable author or publisher of the image.
Full text @ PLoS Biol.