
Image
|
Figure Caption
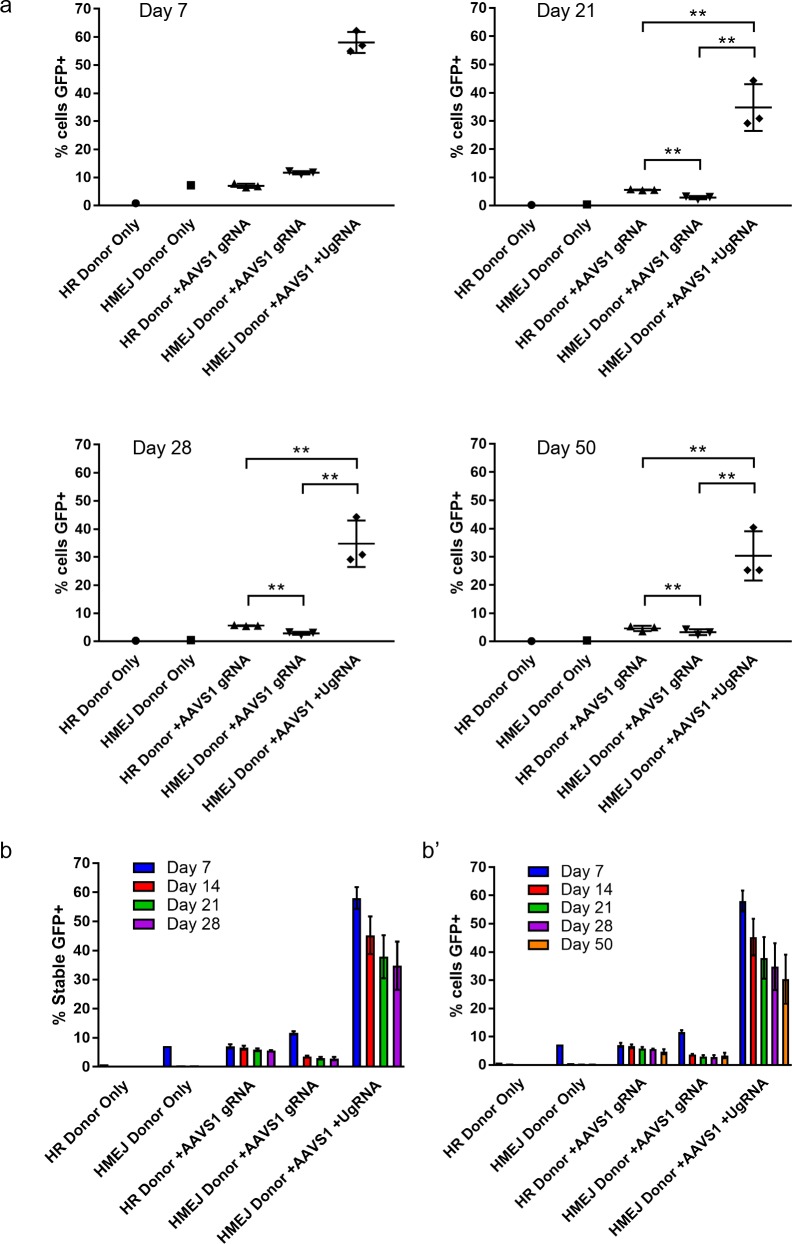
Figure 6—figure supplement 1.
FACs sorted percent of GFP+ cells out of total K-562 cells at day 7, 21, 28, and 50. (b) Summary data for percent of stable GFP+ K-562 cells from day 7, 14, 21, and 28. (b’) Summary data for percent of total cells GFP+ from day 7, 14, 21, 28, and 50. Data represents mean +/- s.e.m. of 3 independent targeting experiments. p values calculated using two-tailed unpaired t-test.
Acknowledgments
This image is the copyrighted work of the attributed author or publisher, and
ZFIN has permission only to display this image to its users.
Additional permissions should be obtained from the applicable author or publisher of the image.
Full text @ Elife