IMAGE

Fig. 2.

ID
ZDB-IMAGE-200509-36
Source
Figures for Veerman et al., 2019
Image
Figure Caption

Fig. 2.

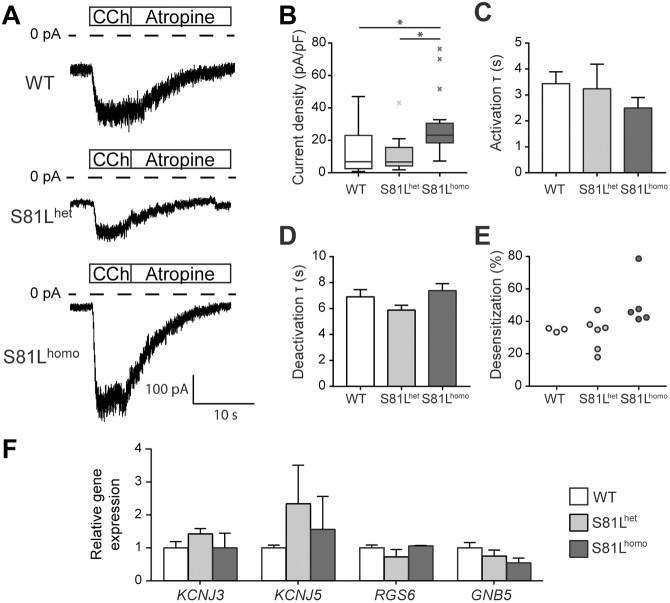
Impact of the Gβ5-S81L variant on IK,ACh in RA-treated hiPSC-CMs. (A,B) Typical recordings (A) and average IK,ACh density (B) in WT, S81Lhet and S81Lhomo hiPSC-CMs. Average IK,ACh density is increased in S81Lhomo hiPSC-CMs compared to WT and S81Lhet hiPSC-CMs. *P<0.05 (Kruskal–Wallis non-parametric test, followed by Bonferroni post-hoc analysis). (C,D) Time constant (τ) of IK,ACh activation (C) and deactivation (D). (B-D) WT, n=27; S81Lhet, n=11; S81Lhomo, n=20 hiPSC-CMs. (E) Percentage of desensitization, measured as the percentage of IK,ACh decrease at steady state upon continuous CCh application; WT, n=3; S81Lhet, n=6; S81Lhomo, n=5 hiPSC-CMs. (F) Transcript level of the genes involved in G-protein-coupled activation of IK,ACh. Data are mean±s.e.m. of three biological differentiation replicas and expression level of each gene in S81Lhet and S81Lhomo hiPSC-CMs is indicated as relative to its expression in WT hiPSC-CMs. No significant differences are observed in KCNJ3, KCNJ5, RGS6 and GNB5 transcript abundance across the WT, S81Lhet and S81Lhomo hiPSC-CMs.

Acknowledgments
This image is the copyrighted work of the attributed author or publisher, and ZFIN has permission only to display this image to its users. Additional permissions should be obtained from the applicable author or publisher of the image. Full text @ Dis. Model. Mech.