Fig. 6
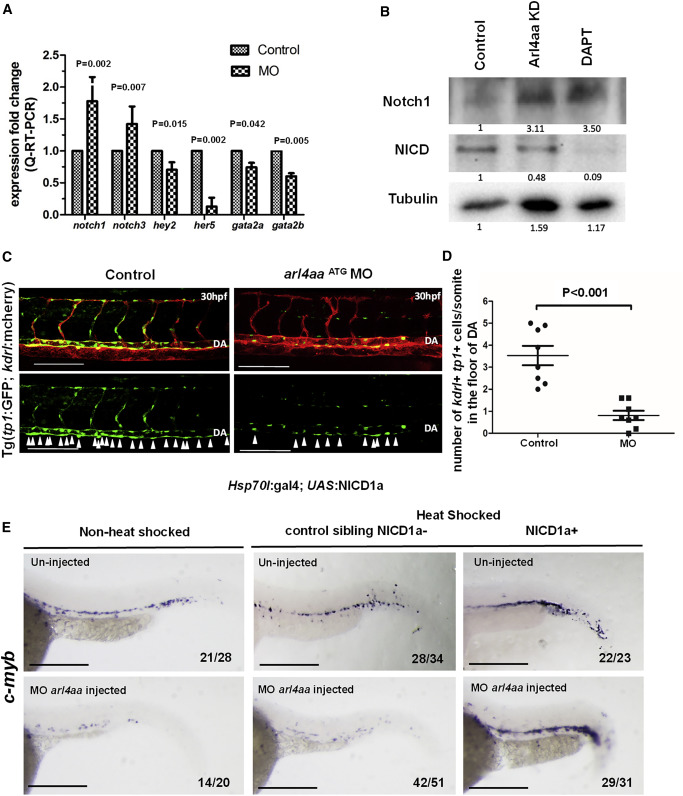
Fig. 6 Knockdown of arl4aa Blocked Cleavage of Notch Receptor Precursor and Downregulated Notch Signaling Pathway along DA Floor (A) Expression of Notch signaling genes in control and arl4aa morphant groups at 42 hpf (notch1, notch3, hey2, and her5) and 33hpf (gata2a and gata2b). Data are representative of three independent experiments with error bars representing the mean ± SEM. (B) Western blot showing Notch1 and NICD protein expression in control, arl4aa morphant embryos, and DAPT-treated embryos at 42 hpf. The numbers indicate the image intensities of immunoblotting relative to those of tubulin in each embryo group. The intensity in the controls was set arbitrarily as 1. The results are representative of at least three experiments. DAPT, N-[N-(3,5-difluorophenacetyl)-L-alanyl]-S-phenylglycine t-butyl ester. (C) Confocal microscope imaging of double transgenic tp1:eGFP; kdrl:mCherry embryos injected with arl4aa MO and examined at 30 hpf. Arrowheads indicate cells in the floor of the DA with active Notch signaling. Scale bar, 100 ?m. (D) Enumeration of tp1 + kdrl + HSCs in the floor of DA (n = 8 embryos per group, p < 0.001). Data are representative of three independent experiments with error bars representing the mean ± SEM. (E) hsp70l:Gal4; UAS:NICD1a embryos injected with arl4aa MO were heat shocked at 14?15 somites and c-myb expression was performed at 36 hpf. Sibling embryos without NICD1a were similarly heat shocked as control. Scale bar, 250 ?m. The number of embryos with typical c-myb expression as shown over the total number of embryos examined is shown in each panel.

