
|
Figure 5
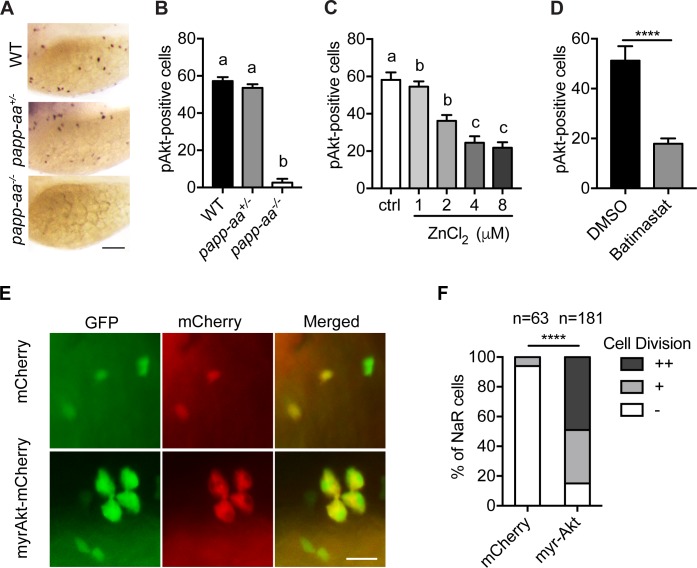
Papp-aa acts by regulating IGF-Akt-Tor signaling in NaR cells.
(A–B) Zebrafish embryos of the indicated genotypes were transferred to the low [Ca2+] medium at three dpf. One day later, they were fixed and stained for phospho-Akt. Representative images are shown in (A) and quantitative results in (B). Scale bar = 0.1 mm. n = 25 ~ 58 fish/group. (C–D) Tg(igfbp5a:GFP) fish were transferred to the low [Ca2+] medium 0–8 µM ZnCl2 (C) or 200 µM batimastat (D) at three dpf. After one day treatment, they were analyzed by immunostaining for phospho-Akt. n = 18 ~ 24 fish/group. ****, p<0.0001, unpaired two-tailed t test. (E and F) Progeny of papp-aa+/-;Tg(igfbp5a:GFP) intercrosses were injected with BAC(igfbp5a:mCherry) or BAC(igfbp5a:myr-Akt-mCherry). They were raised and subjected to the low [Ca2+] stress test described in Figure 2A. NaR cells expressing mCherry or myr-Akt were scored as described in Figure 3. Representative images are shown in (E) and quantified data in (F). ++, two cell division, +, one cell division, -, no division during the experiment. Scale bar = 20 µm. ****, p<0.0001 by Chi-square test. Total number of cells is shown above the bar.