
Image
|
Figure Caption
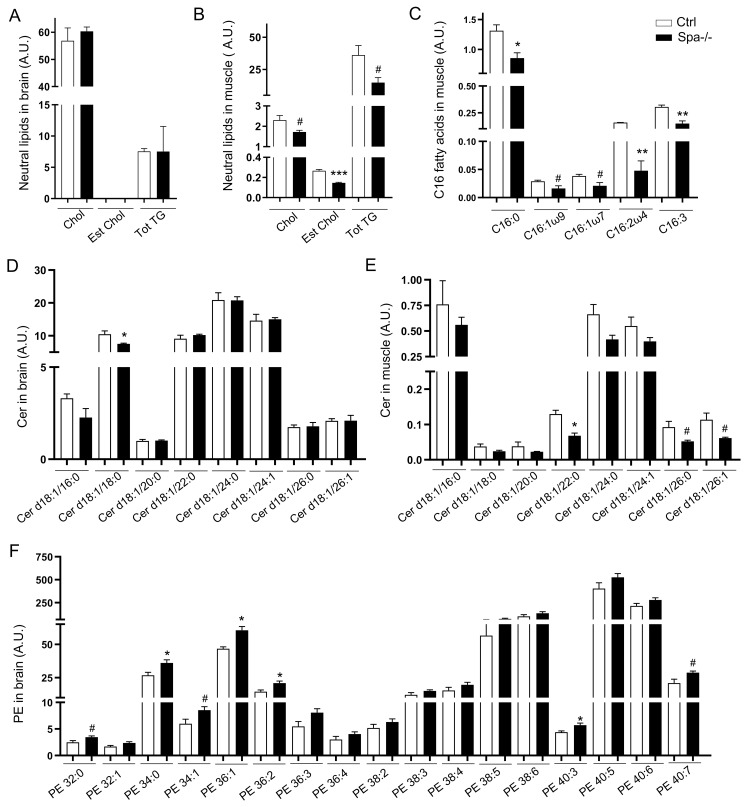
Fig 8
(A-B) Unesterified cholesterol (Chol), total esterified cholesterol (Est Chol) and total triacylglycerides (Tot TG) in brain (A) and in muscle (B). (C) Fatty acids composed of C16 in muscle. (D-E) Ceramides (Cer) in brain (D) and muscle (E). (F) Phosphatidylethanoamines (PE) in brain. All values correspond to lipid quantity per total protein amount. Bars are mean ± SEM (n = 3 per group), #
Figure Data
Acknowledgments
This image is the copyrighted work of the attributed author or publisher, and
ZFIN has permission only to display this image to its users.
Additional permissions should be obtained from the applicable author or publisher of the image.
Full text @ PLoS Genet.