IMAGE

Fig. 4

ID
ZDB-IMAGE-200426-19
Genes
Antibodies
Source
Figures for Zhang et al., 2020
Image
Figure Caption

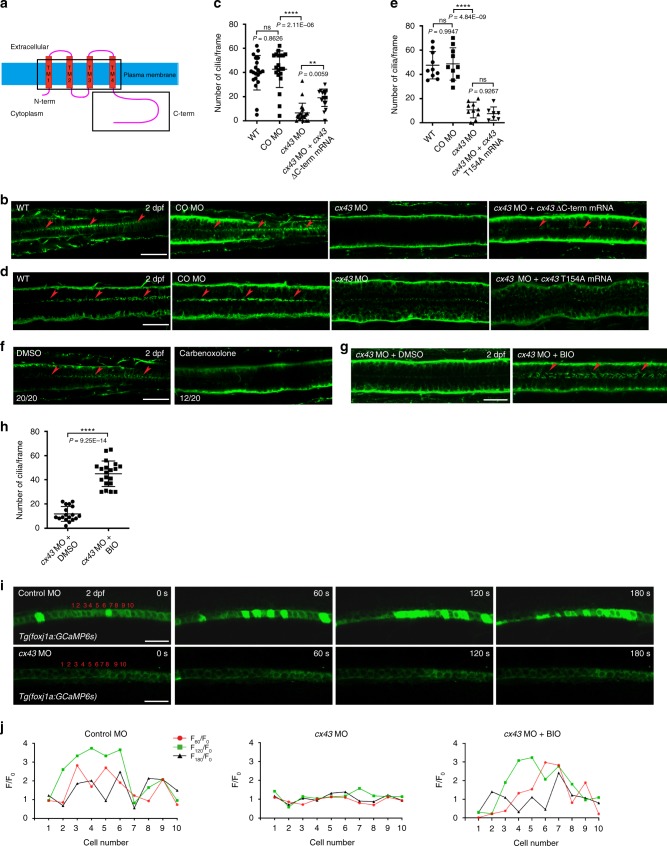
Fig. 4 The electrochemical coupling function of Cx43 plays an important role in the maintenance of ependymal motile cilia.

a Domain structure of Cx43. TM, transmembrane. b, d Embryos at one-cell stage were microinjected with control MO, cx43 MO or cx43 MO + mRNA encoding mouse Cx43 lacking the C-terminal domain (b) or cx43 MO + mRNA that encodes mouse mutant Cx43 lacking the channel function (d), and IF stained with anti-acetylated α-tubulin antibody at 2 dpf. Arrowheads represent motile cilia. Dorsal view anterior to the left. Scale bar = 20 μm. c, e Quantification of the number of ependymal motile cilia in b, d, respectively. Mean ± SD. **P < 0.01 and ****P < 0.0001 by one-way ANOVA with Tukey’s HSD post hoc test: cn = 20 embryos per each group; en = 10 embryos per each group except cx43 MO + cx43 T154A mRNA (n = 7 embryos). ns, not significant. f Embryos were treated with carbenoxolone (1 μM) at 18–48 hpf and immunostained with anti-acetylated α-tubulin antibody at 2 dpf. Arrowheads point to motile cilia. Dorsal view anterior to the left. Scale bar = 20 μm. g Embryos at one-cell stage were microinjected with cx43 MO, treated with either DMSO (vehicle control) or BIO (5 μM) at 12–48 hpf, and IF stained with anti-acetylated α-tubulin antibody at 2 dpf. Arrowheads represent motile cilia. Dorsal view anterior to the left. Scale bar = 20 μm. h Quantification of the number of ependymal motile cilia per frame in embryos in g. Mean ± SD. ****P < 0.0001 by two-tailed unpaired Student’s t test (cx43 MO + DMSO: n = 18 embryos; cx43 MO + BIO: n = 20 embryos; one frame per embryo). iTg(foxj1a:GCaMP6s) embryos expressing a calcium indicator (GCaMP6s) in ECs were microinjected at one-cell stage with control MO or cx43 MO, and cx43 morphants were treated with BIO (5 μM) at 12–48 hpf. Subsequently, they were subjected to time-lapse imaging for 3 min (20 frames/min) with a confocal microscope. Dorsal view anterior to the left. Scale bar = 20 μm. j The GFP fluorescence intensity in ten cells (1–10) in each embryo in i was individually assessed at 0 (F0), 60 (F60), 120 (F120) and 180 s (F180), and presented as F60/F0, F120/F0 and F180/F0.

Figure Data
Acknowledgments
This image is the copyrighted work of the attributed author or publisher, and ZFIN has permission only to display this image to its users. Additional permissions should be obtained from the applicable author or publisher of the image. Full text @ Nat. Commun.