IMAGE

Figure 2.

ID
ZDB-IMAGE-200423-114
Source
Figures for Lim et al., 2020
Image
Figure Caption

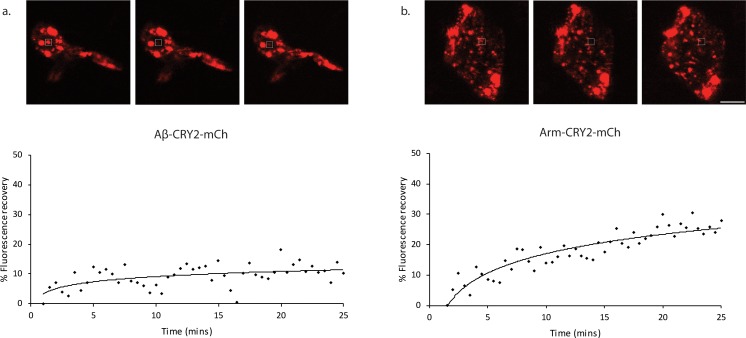
Figure 2. Fluorescence recovery after photobleaching (FRAP) analysis of Aβ-CRY2-mCh expressing cells compared to Arm-CRY2-mCh expressing cells in<italic>Drosophila</italic>gut.

Images and percentage fluorescence recovery after bleaching of (a) Aβ-CRY2-mCh expressing intestinal stem cells from esg-Gal4, UAS-GFP; UAS--Cry2-mCh flies and (b) Arm-CRY2-mCh expressing stem cells from esg-Gal4, UAS-GFP; UAS-Arm-Cry2-mCh flies. Aβ-Cry2-mCh showed a much slower recovery of fluorescence post-bleaching as compared to an unrelated CRY2 construct (Arm-CRY2-mCh). Scale bar represents 5 µm.

Acknowledgments
This image is the copyrighted work of the attributed author or publisher, and ZFIN has permission only to display this image to its users. Additional permissions should be obtained from the applicable author or publisher of the image. Full text @ Elife