
Image
|
Figure Caption
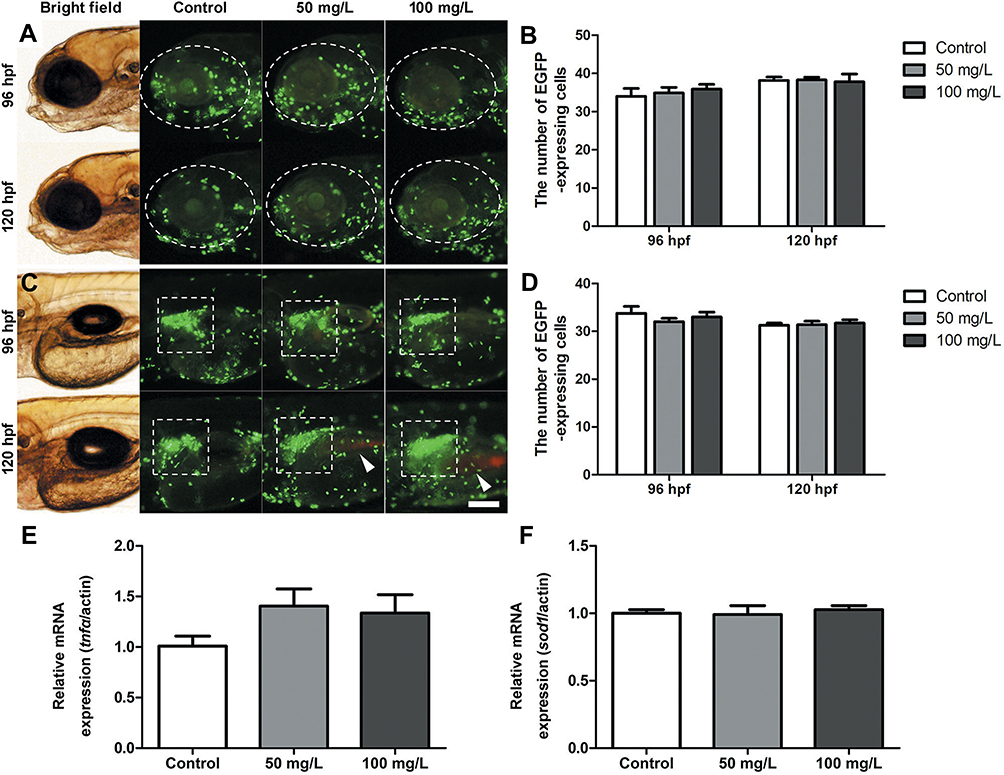
Fig. 4 Inflammatory response following NPMOF exposure. (A and C) The distribution of neutrophils in the (A) ocular region and (C) hepatic region. (B and D) Statistical analysis of the number of neutrophils in the ocular (A, circle) and hepatic regions (C, square), respectively. The red fluorescence is emitted by NPMOF in the gastrointestinal tract (C, arrowheads). (E and F) The expression of tnf? and sod1. Dorsal is up and rostral is left in (A) and (C). Scale bar in (A): 100 ?m.
Acknowledgments
This image is the copyrighted work of the attributed author or publisher, and
ZFIN has permission only to display this image to its users.
Additional permissions should be obtained from the applicable author or publisher of the image.
Full text @ Int. J. Nanomedicine