
|
Fig. 5-S2
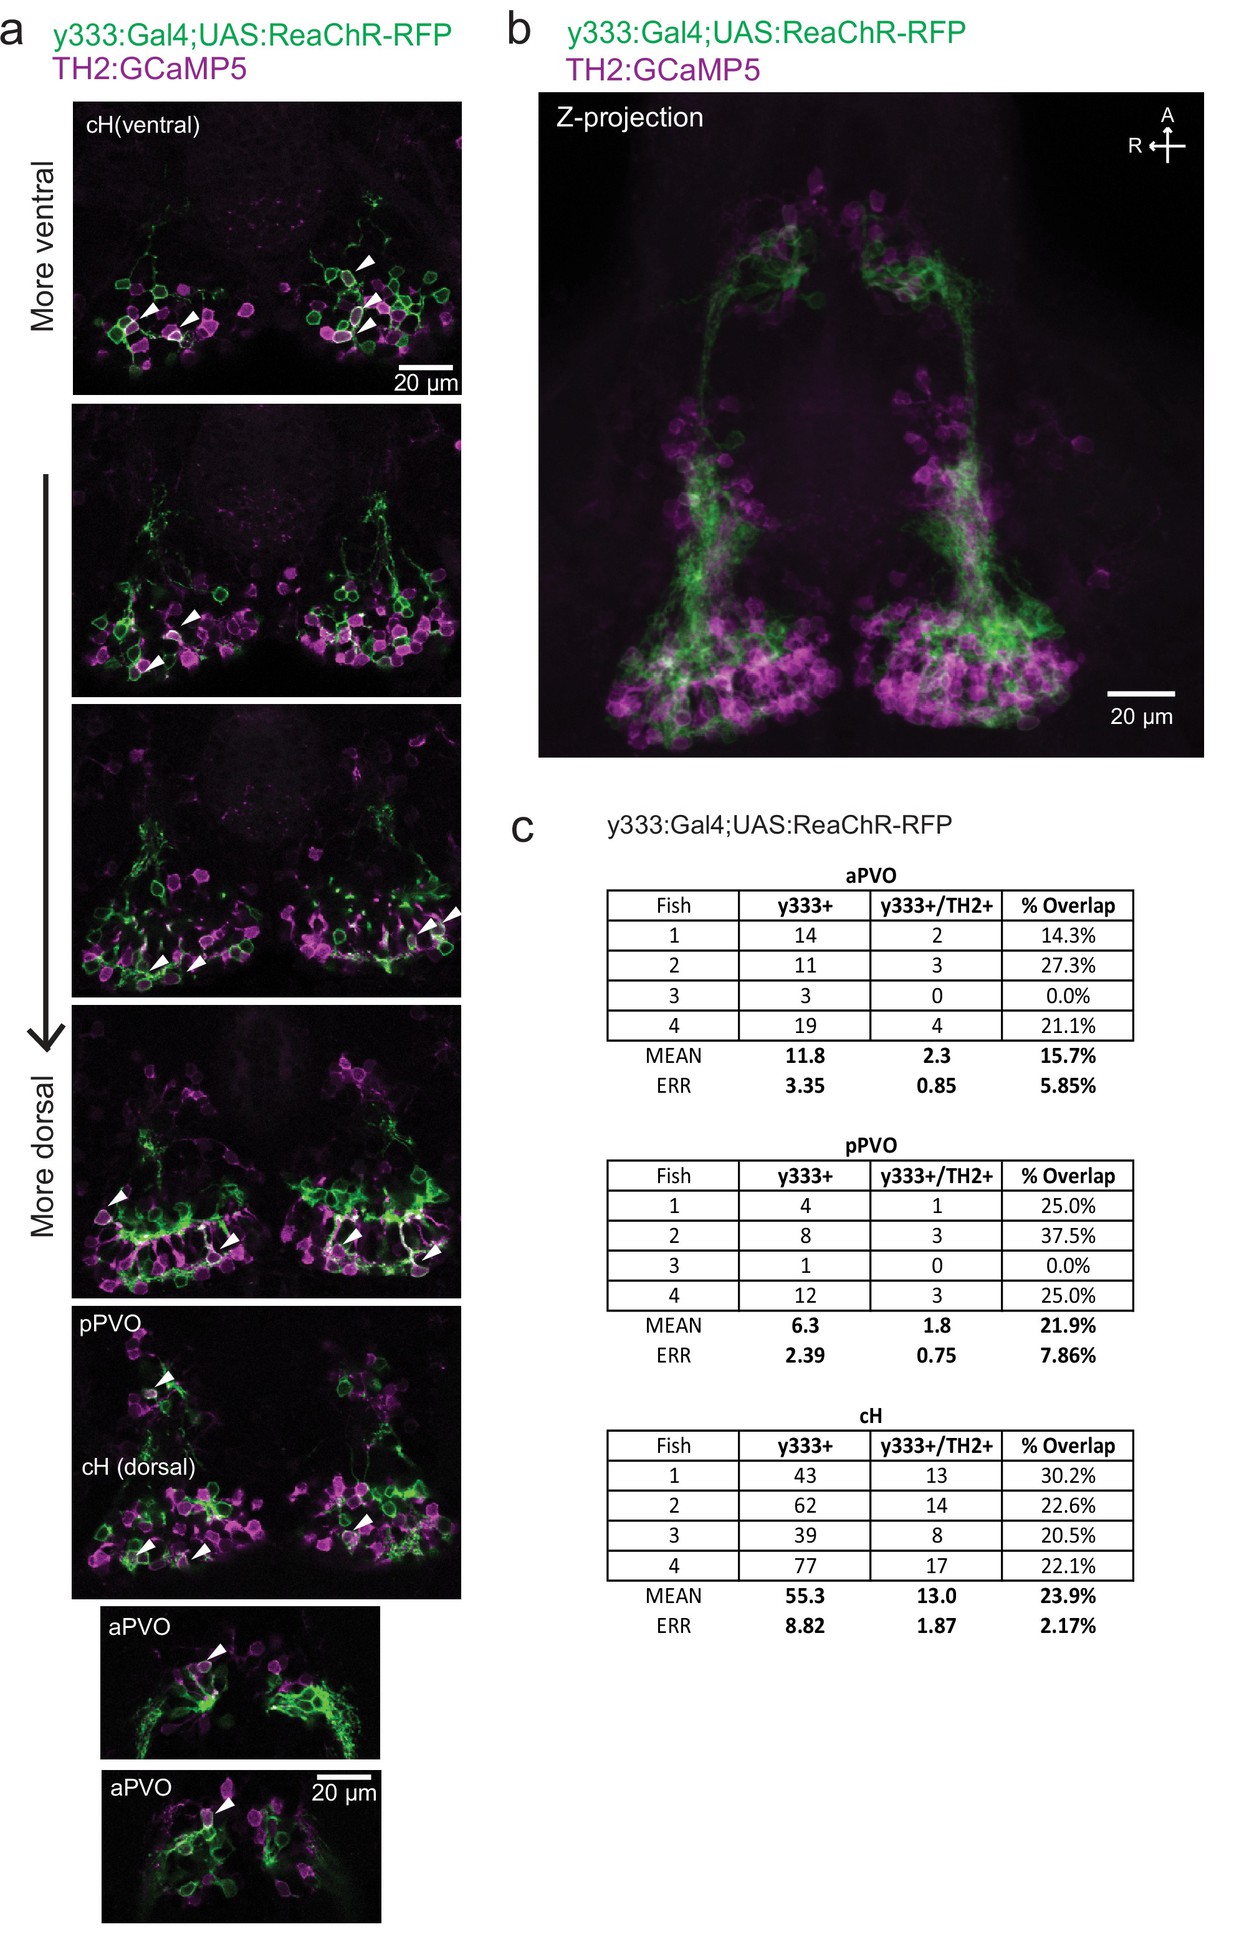
Characterization of the dopaminergic identity of the y333:Gal4 line.
The Tg(y333:Gal4; UAS:ReaChR-RFP) line (green) was crossed to Tg(TH2:GCaMP5) (magenta) to quantify the overlap of Tg( y333:Gal4) with dopaminergic (TH2-positive) cells. ( a) High magnification image showing moderate overlap of Tg(y333:Gal4;UAS:ReaChR-RFP) (green) with TH2-expressing cells (magenta) in the cH and PVO. Arrows indicate cells with overlapping RFP and TH2 expression. Scale bar = 20 μm. A = anterior, R = right. ( b) Z-projection image of the same brain shown in ( a), with Tg(TH2:GCaMP5) expression shown in magenta. Scale bar = 20 μm. ( c) Quantification of overlap between Tg(TH2:GCaMP5) and Tg(y333:Gal4;UAS:ReaChR-RFP) expression in the cH and PVO.