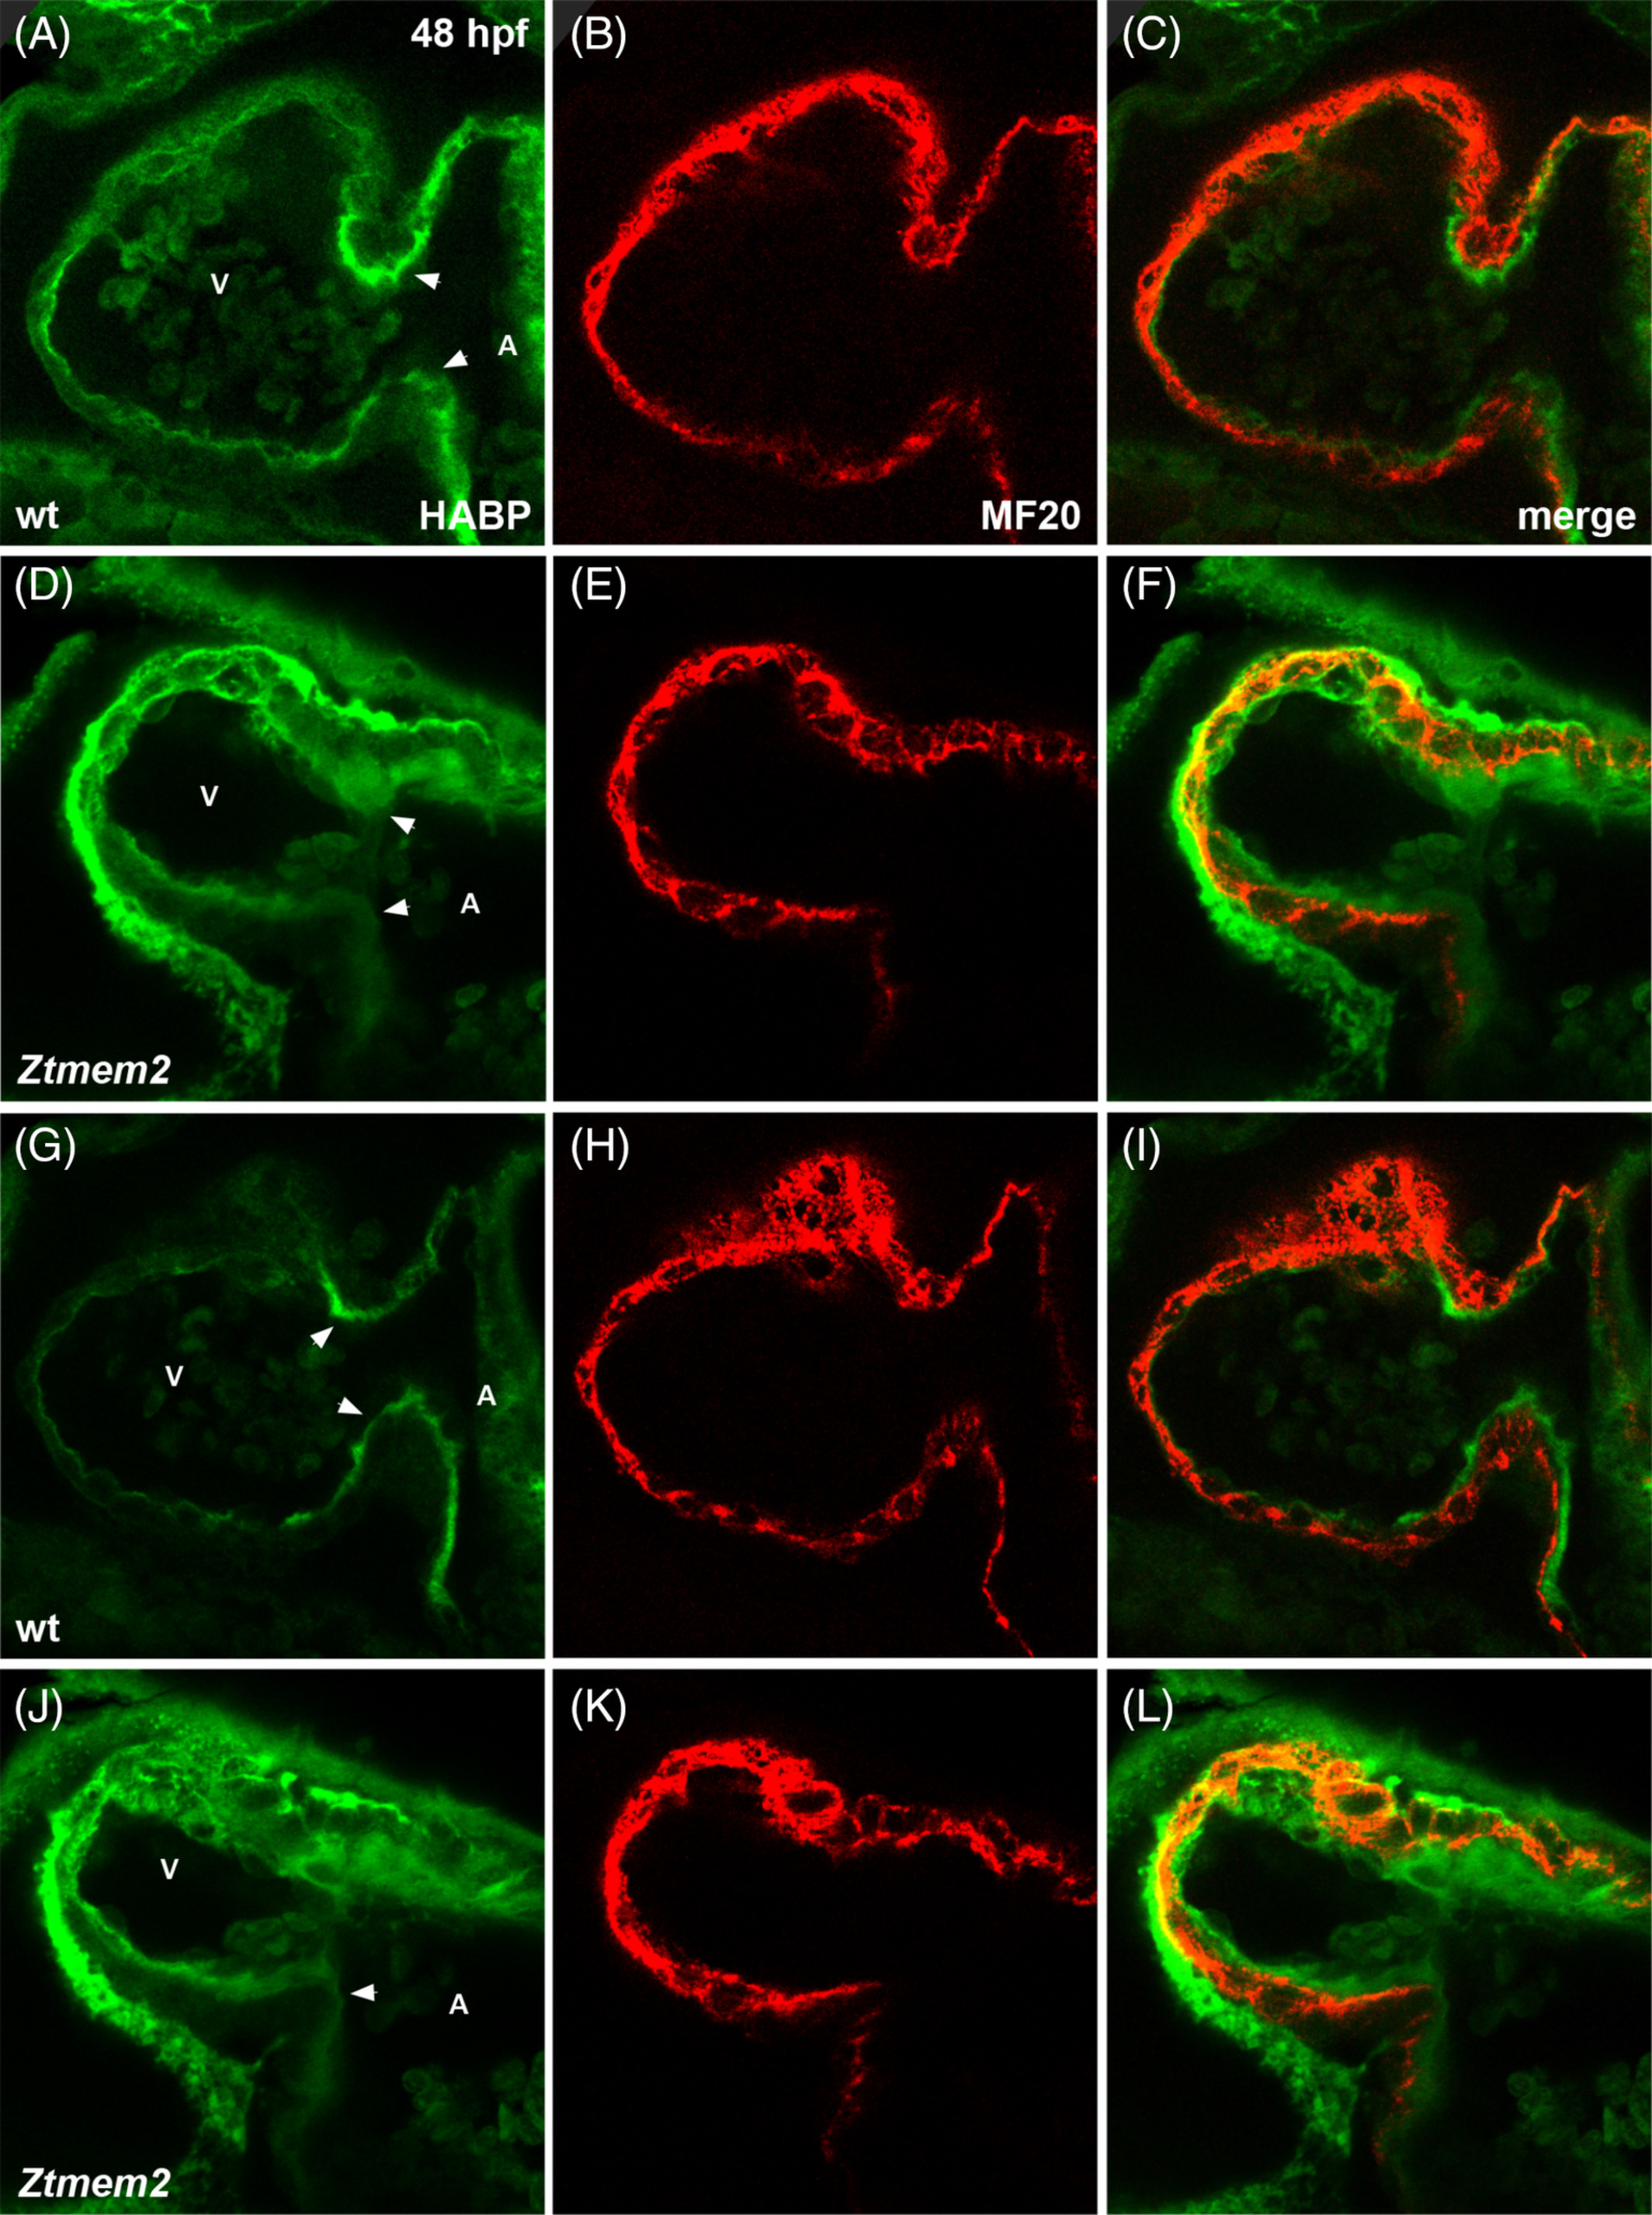
Fig. 6 Ztmem2 mutants exhibit excess HA deposition. Immunofluorescence with MF20 (red) to label the myocardium and HABP (green) to label HA in single optical slices through wt (A?C) and Ztmem2 mutant (D?F) hearts at 48 hpf. In wt, a thin layer of HA is visible throughout the ventricle, adjacent to the myocardium, and increased concentration of HA is visible within the AVC (A, arrowheads). In contrast, Ztmem2 mutants display increased levels of HA throughout the ventricle and at the AVC (D, arrowheads). Separate optical slices (G?L), 2.5 microns away from those shown in (A?F), provide a better view of the inferior portion of the AVC in the same wt (G?I) and Ztmem2 mutant (J?L) hearts. V and A indicate the ventricle and atrium, respectively. For wt, n = 8; for Ztmem2, n = 6
Image
Figure Caption
Figure Data
Acknowledgments
This image is the copyrighted work of the attributed author or publisher, and
ZFIN has permission only to display this image to its users.
Additional permissions should be obtained from the applicable author or publisher of the image.
Full text @ Dev. Dyn.

