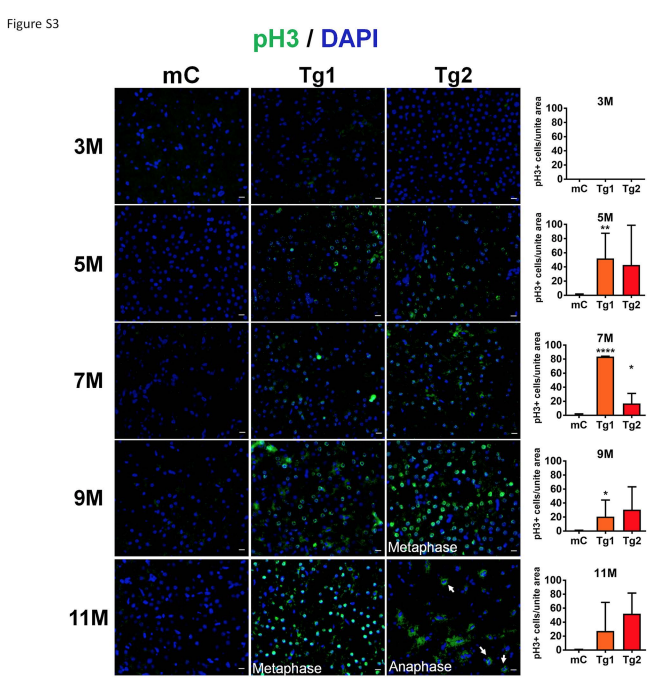
Fig. S3 Phosphorylation of Histone 3 at Ser10 (pH3) is Elevated in RPIA Transgenic Zebrafish Representative immunofluorescent images of pH3 (green) were showed for control (mC), and two RPIA transgenic fish (Tg1 and Tg2). The location of pH3 with DAPI (blue) took place in nucleus in transgenic liver sections from five months. In eleven months of Tg1 and nine months of Tg2, the significant stronger pH3 signals were observed. In eleven months of Tg2, the dividing cells were revealed as anaphase in transgenic liver. All the magnifications were 400X. Scale bar: 40 ?m. The numbers of pH3-positive cells per united area were shown next to the representative images.
Image
Figure Caption
Acknowledgments
This image is the copyrighted work of the attributed author or publisher, and
ZFIN has permission only to display this image to its users.
Additional permissions should be obtained from the applicable author or publisher of the image.
Full text @ Carcinogenesis

