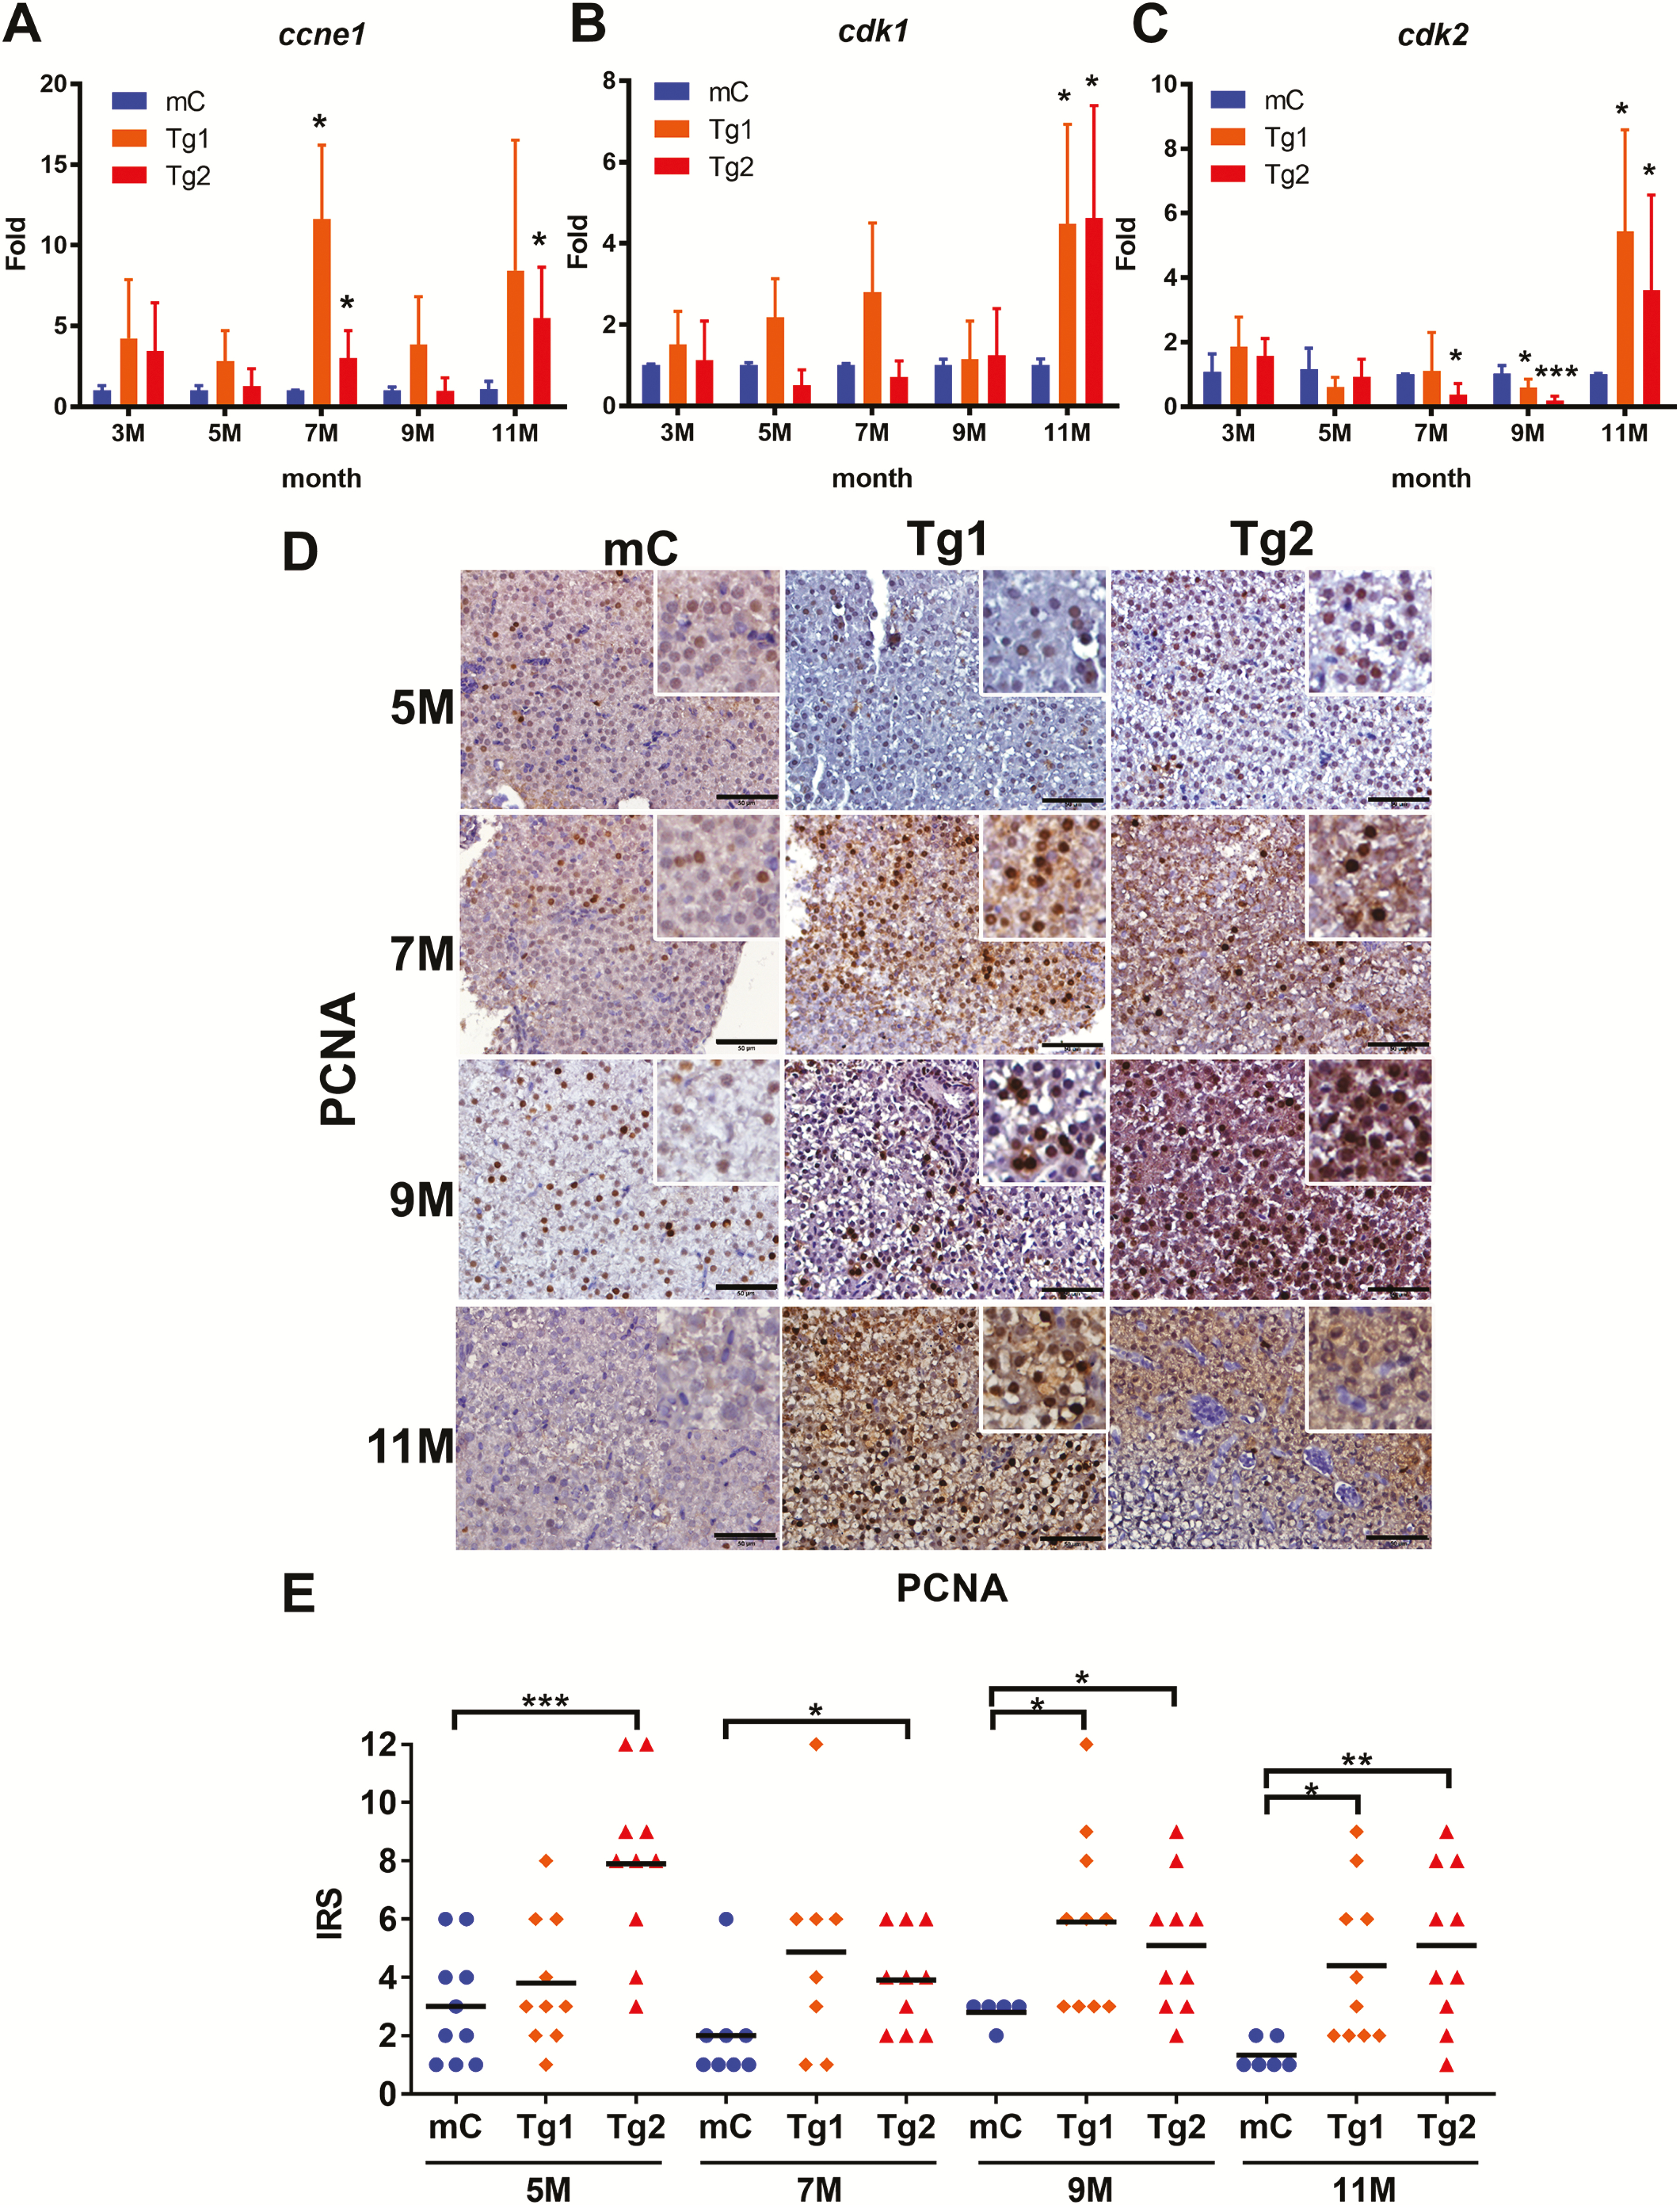
Fig. 3 RPIA-transgenic fish increase expression of cell cycle/proliferation markers and PCNA nuclear staining. (A–C) QPCR was used to measure the relative mRNA fold induction of the cell cycle/proliferation markers ccne1, cdk1 and cdk2 in two independent lines of RPIA-transgenic fish (Tg1 and Tg2) compared with the control fish (mC) at 3, 5, 7, 9 and 11 months of age. (D) Representative images of PCNA IHC result for the control (mC) and Tg1 and Tg2 fish aged 5–11 months. All of the magnifications were ×400. Scale bar: 50 μm. (E) Statistical analysis of the PCNA IHC staining results from Tg1 and Tg2 compared with control, as determined by the IRS scoring system. Statistical analysis was performed by two-tailed Student’s t-tests. The symbol ‘*’ represents significance between RPIA-transgenic fish and GFP-mCherry control. P < 0.05 was considered to be statistically significant; *: 0.01 < P ≤ 0.05; **: 0.001 < P ≤ 0.01; ***: P ≤ 0.001.
Image
Figure Caption
Figure Data
Acknowledgments
This image is the copyrighted work of the attributed author or publisher, and
ZFIN has permission only to display this image to its users.
Additional permissions should be obtained from the applicable author or publisher of the image.
Full text @ Carcinogenesis

