
|
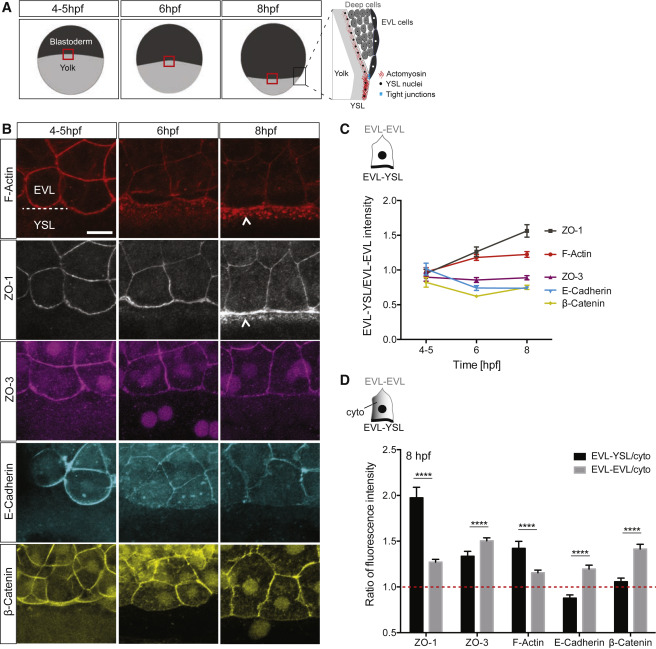
Fig. 1 TJ Components Accumulate at the EVL-YSL Boundary (A) Schematic representation of enveloping cell layer (EVL) spreading during consecutive stages of epiboly (4?5, 6, and 8 hpf). Yolk cell, light gray; blastoderm (EVL and deep cells), dark gray. The black rectangle demarcates the region of the enlarged sagittal view outlining the tissue structure at 8 hpf. The red rectangle demarcates regions of the EVL-YSL boundary shown in (B). (B) Maximum intensity projections (MIPs) of F-actin, ZO-1, ZO-3, E-cadherin, and ?-catenin localization at the EVL-YSL boundary at 4?5, 6, and 8 hpf. ZO-1, ZO-3, E-cadherin, and ?-catenin were detected by immunohistochemistry, and F-actin by Phalloidin. White arrowheads point to increased accumulation at the EVL-YSL boundary. Scale bar, 20 ?m. (C) Plot of EVL-YSL junctional intensity normalized to EVL-EVL junctional intensity as a function of time during EVL epiboly (see also schematic above). Data are mean at 95% confidence. F-actin with N = 2, n = 15 at 4?5 hpf, n = 42 at 6 hpf, and n = 46 at 8 hpf. ZO-1 with N = 2, n = 15 at 4?5 hpf, n = 42 at 6 hpf, and n = 46 at 8 hpf. ZO-3 with N = 2, n = 26 at 4?5 hpf, n = 52 at 6 hpf, and n = 58 at 8 hpf. E-cadherin with N = 3, n = 29 at 4?5 hpf; with N = 2, n = 32 at 6 hpf; and with N = 3, n = 84 at 8 hpf. ?-Catenin with N = 2, n = 54 at 4?5 hpf, n = 29 at 6 hpf, and n = 28 at 8 hpf. (D) Plot of EVL-YSL junctional intensity (black) and EVL-EVL junctional intensity (gray) normalized to cytoplasmic intensity at 8 hpf. The red dashed line indicates a ratio of 1, demarcating the boundary between accumulation (>1) and depletion (<1). Data are mean at 95% confidence. N/n same as in (C), except for E-cadherin with N = 2, n = 40. Mann-Whitney test for F-Actin, ZO-3, and E-cadherin; unpaired t test for ZO-1 and ?-catenin. ????p < 0.0001; n, number of cells. See also Figure S1.
Reprinted from Cell, 179, Schwayer, C., Shamipour, S., Pranjic-Ferscha, K., Schauer, A., Balda, M., Tada, M., Matter, K., Heisenberg, C.P., Mechanosensation of Tight Junctions Depends on ZO-1 Phase Separation and Flow, 937-952.e18, Copyright (2019) with permission from Elsevier. Full text @ Cell