IMAGE

Fig. 1.

ID
ZDB-IMAGE-200314-81
Source
Figures for Bryan et al., 2020
Image
Figure Caption

Fig. 1.

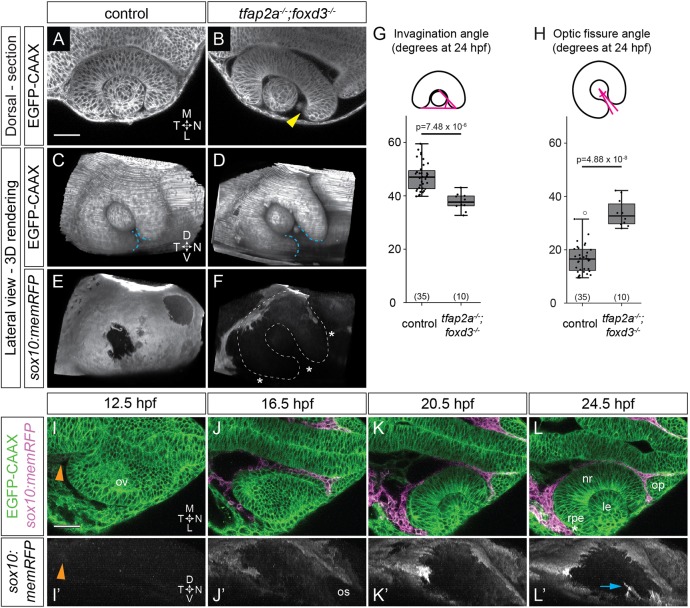
Optic cup morphogenesis requires neural crest. (A-F) Dorsal (A,B) and lateral (C-F) views of 24 hpf Tg(bactin2:EGFP-CAAX);Tg(sox10:memRFP) double-transgenic control and tfap2a;foxd3 mutant optic cups. A and B show single confocal sections at the dorsal-ventral midpoint of the lens. Arrowhead in B marks a gap where nasal retina fails to fully enwrap the lens. White dashed lines in F mark the optic cup boundaries. Blue dashed lines (C,D) mark the optic fissure margins. Asterisks in F indicate regions lacking neural crest. (G,H) Quantification of invagination angle (G) and optic fissure angle (H) measured as shown in inset diagrams. n (embryos) shown at base of graphs, from three experiments. P-values were calculated using one-way ANOVA with Tukey HSD post-hoc test. (I-L′) Time-lapse imaging (12.5-24.5 hpf) of a Tg(bactin2:EGFP-CAAX);Tg(sox10:memRFP) double-transgenic embryo. (I-L) Dorsal view, single confocal sections. (I′-L′) Lateral view, 3D rendering of magenta channel from same dataset. Arrowheads in I,I′ indicate RFP+ neural crest. Asterisk in L marks RPE between neural crest and neural retina. Arrow in L′ marks neural crest-derived cells entering the optic fissure. Scale bars: 50 μm. D, dorsal; L, lateral; le, lens; M, medial; N, nasal; nr, neural retina; op, olfactory placode; os, optic stalk; ov, optic vesicle; rpe, retinal pigment epithelium; T, temporal; V, ventral.

Figure Data
Acknowledgments
This image is the copyrighted work of the attributed author or publisher, and ZFIN has permission only to display this image to its users. Additional permissions should be obtained from the applicable author or publisher of the image. Full text @ Development