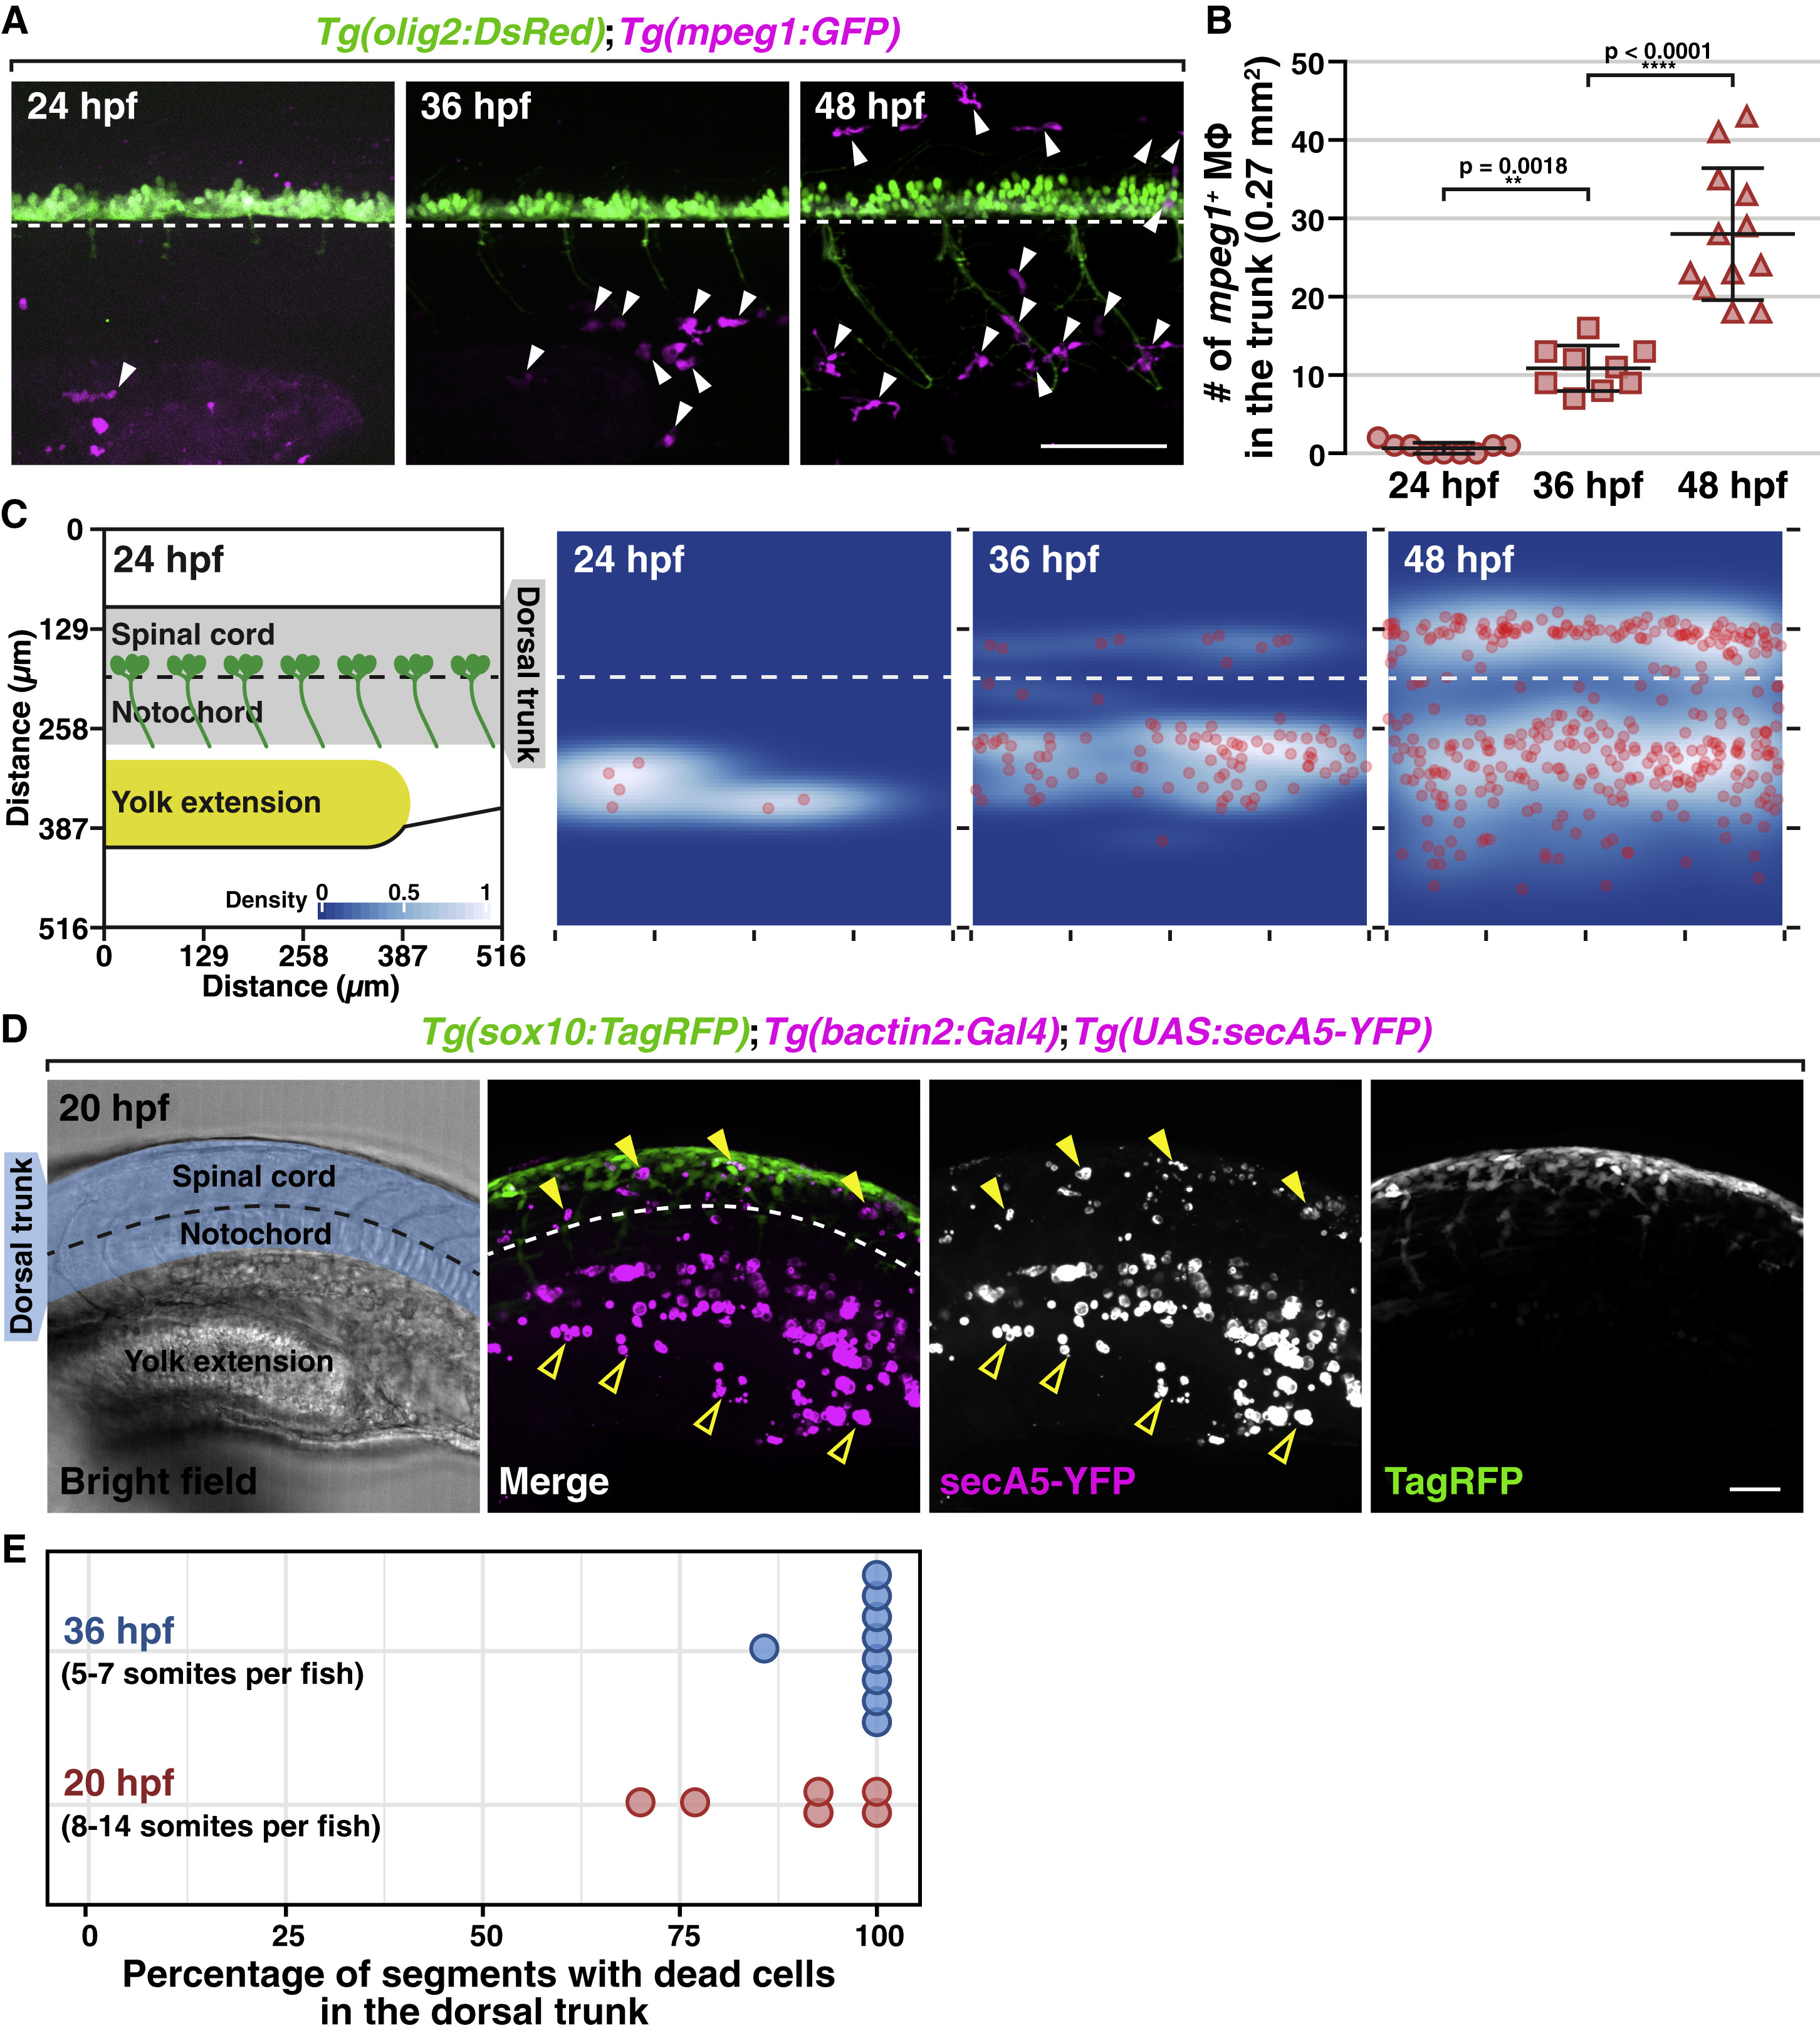
Fig. 1 NCCs, but Not Macrophages, Colonize the Trunk Region during Early Development (A) Trunk lateral views of Tg(olig2:DsRed);Tg(mpeg1:GFP) embryos at 24, 36, and 48 hpf. Arrowheads denote mpeg1+ macrophages. (B) Macrophage quantification in a 0.27 mm2 region in the trunk of embryos at 24, 36, and 48 hpf (mean ± SD). (C) 2D distribution of macrophages in the trunk of embryos at 24, 36, and 48 hpf (n = 9 fish in each condition). Diagram on the left shows the region quantified. All images used for quantification are aligned based on the position of the ventral edge of the spinal cord (dashed line). (D) Lateral view of a Tg(sox10:TagRFP);Tg(bactin2:Gal4);Tg(UAS:secA5-YFP) embryo at 20 hpf. Blue shading denotes dorsal trunk. Filled arrowheads denote dead cells in the dorsal trunk. Open arrowheads denote debris in the ventral trunk/yolk extension. (E) Quantification of the percentage of somites with secA5+ cells in 20 and 36 hpf embryos (n = 65/56 somites in 6/9 fish for 20/36 hpf). Dashed lines mark the ventral edge of the spinal cord. Scale bars, 50 ?m.
Reprinted from Cell, 179(1), Zhu, Y., Crowley, S.C., Latimer, A.J., Lewis, G.M., Nash, R., Kucenas, S., Migratory Neural Crest Cells Phagocytose Dead Cells in the Developing Nervous System, 74-89.e10, Copyright (2019) with permission from Elsevier. Full text @ Cell

