
|
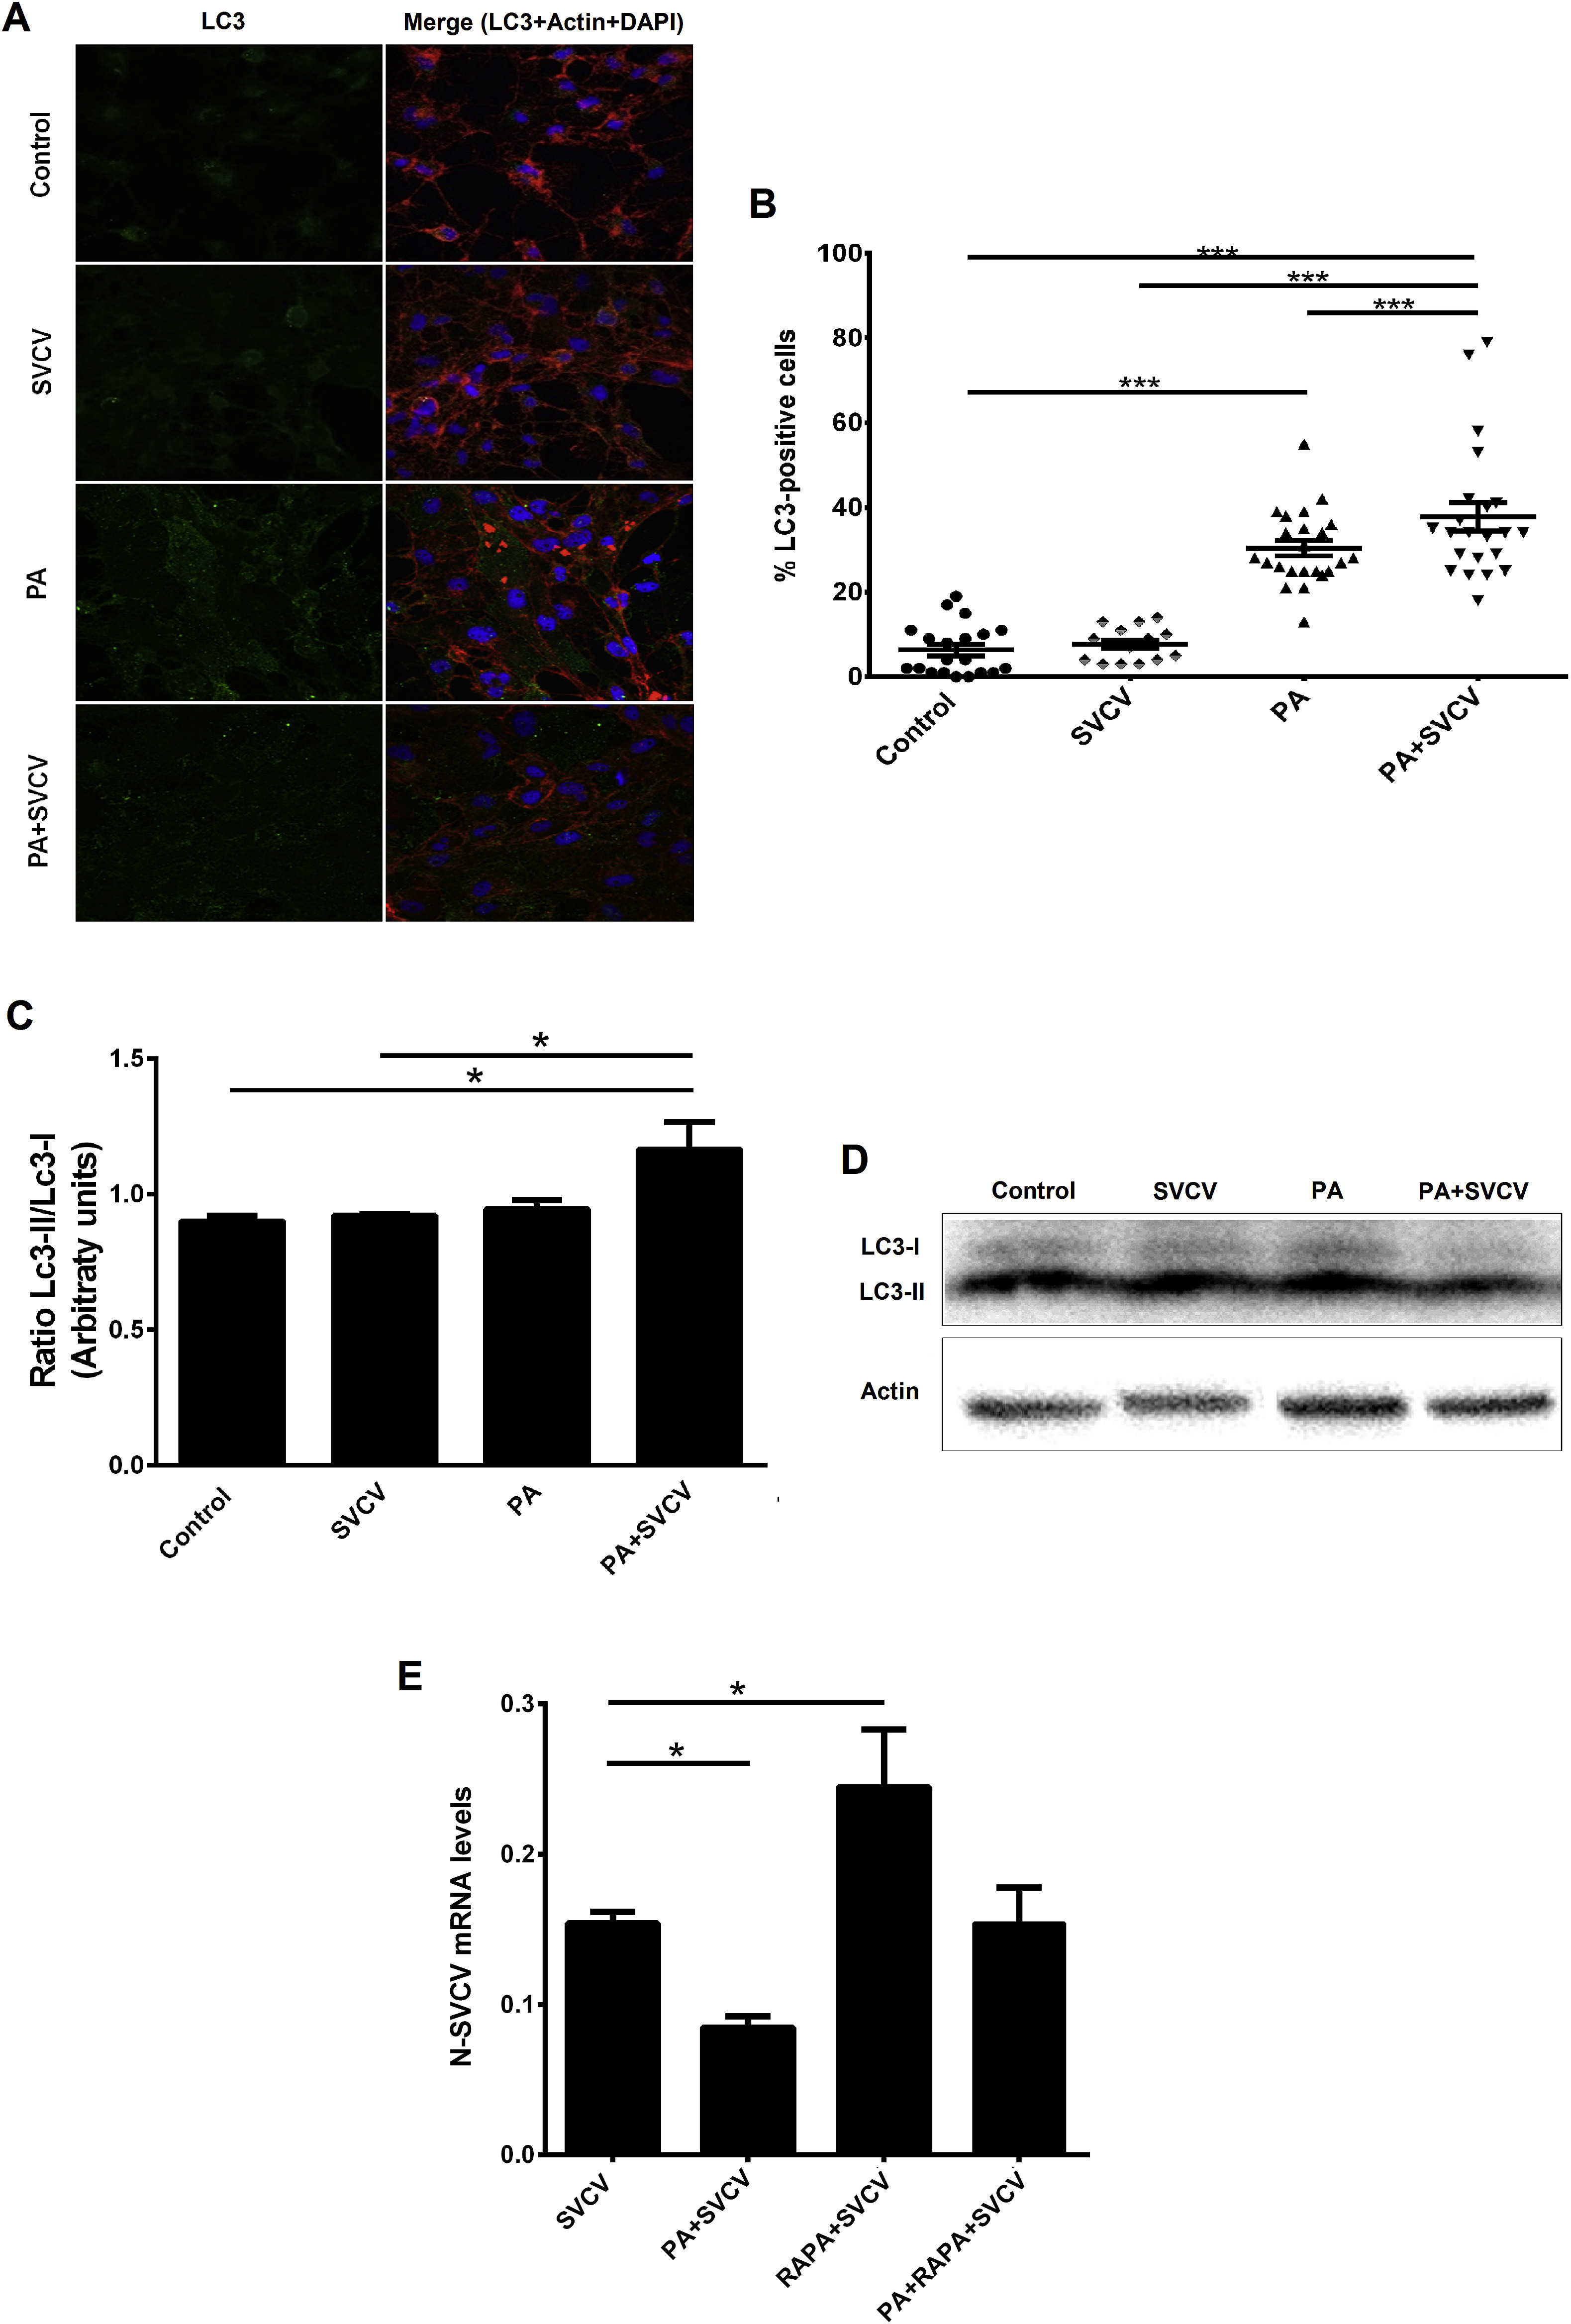
Fig. 4
Palmitic acid increases the Lc3b signal in ZF4 cells. (A) The ZF4 cells were incubated with PA for 24 h and subsequently infected or not with SVCV. At 24 hpi, the cells were fixed and immuno-stained for Lc3b (green) and actin (red) detection. Nuclei were stained with DAPI (blue). Images were taken by confocal microscopy to determine the proportion of Lc3-positive cells. (B) The percentage of Lc3-positive ZF4 cells after different treatments. Data are presented as the mean ± SEM of four independent experiments. (C, D) Western blot analysis of the Lc3 in ZF4 cells after PA treatment and/or SVCV infection. Graphs represent the Lc3-II/Lc3-I ratio. The actin bands were detected using an anti-actin antibody as an internal control for protein load. Data are shown as the mean ± SEM of 4 independent experiments. (E) Detection of the SVCV N gene in ZF4 cells incubated with PA, RAPA or PA + RAPA for 24 h and then infected with SVCV. The graph represents the means ± SEM of 5 independent biological replicates. Comparisons among groups were made using Student's t-test (paired comparisons) or one-way ANOVA (multiple comparisons) followed by a Student-Newman-Keuls test, and the differences were considered statistically significant at p < 0.05. Significant differences are displayed as *** (0.0001 < p < 0.001), ** (0.001 < p < 0.01) or * (0.01 < p < 0.05). (For interpretation of the references to colour in this figure legend, the reader is referred to the Web version of this article.)