IMAGE

Fig. 3

ID
ZDB-IMAGE-200227-5
Genes
Antibodies
Source
Figures for Chen et al., 2020
Image
Figure Caption

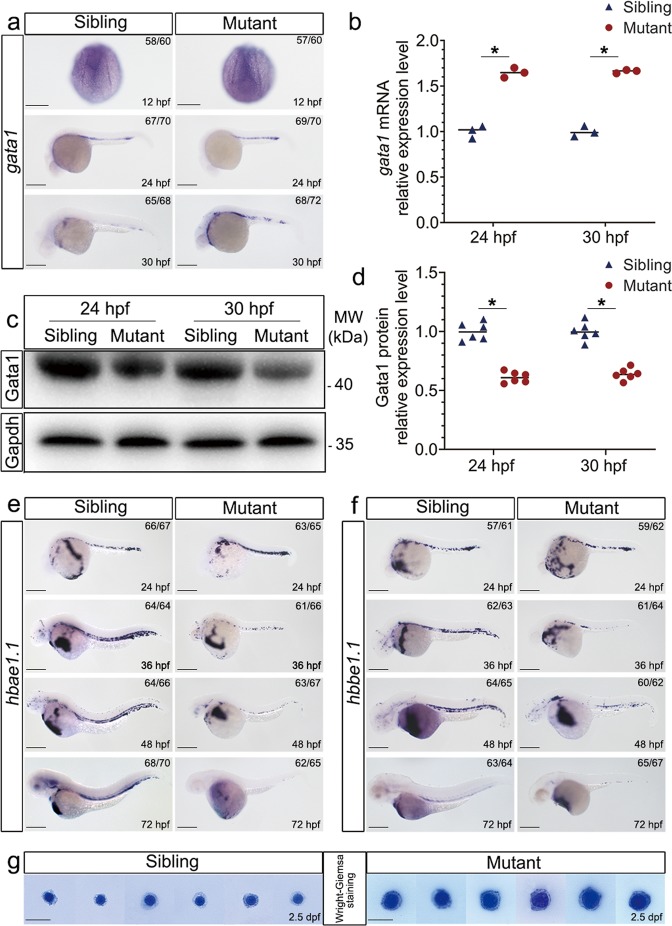
Fig. 3 Rpl18 deficiency impaired the erythroid maturation.

a WISH showed that expression levels of gata1 in rpl18−/− embryos was slightly increased at 24 and 30 hpf (N = 3). b Relative expression of gata1 mRNA was analyzed by qRT-PCR for rpl18 siblings and mutants (N = 3). *P < 0.05. c Western blot (WB) analysis was performed to determine Gata1 protein level. WB with Gata1 antibody demonstrated its reduction in rpl18−/ mutants at 24 and 30 hpf. d The scatter diagram represented quantification of WB. Compared with siblings, the expression of Gata1 protein in mutants decreased by about 40%. The results of three groups of experiments (each experiment was repeated twice) were statistically analyzed, *P < 0.05. WISH showed that expression levels of hbae1.1 (e) and hbbe1.1 (f) in mutants were unaffected at 24 hpf, but reduced significantly from 36 hpf (N = 3). Scale bars represent 250 μm. g Wright–Giemsa staining of isolated erythroid cells collected from zebrafish embryos at 2.5 dpf. The nucleoli size of erythrocyte in rpl18 mutants was much larger than siblings (N = 4). Scale bars represent 10 μm.

Figure Data
Acknowledgments
This image is the copyrighted work of the attributed author or publisher, and ZFIN has permission only to display this image to its users. Additional permissions should be obtained from the applicable author or publisher of the image. Full text @ Cell Death Dis.