IMAGE

Fig. 4

ID
ZDB-IMAGE-200227-1
Source
Figures for Chen et al., 2020
Image
Figure Caption

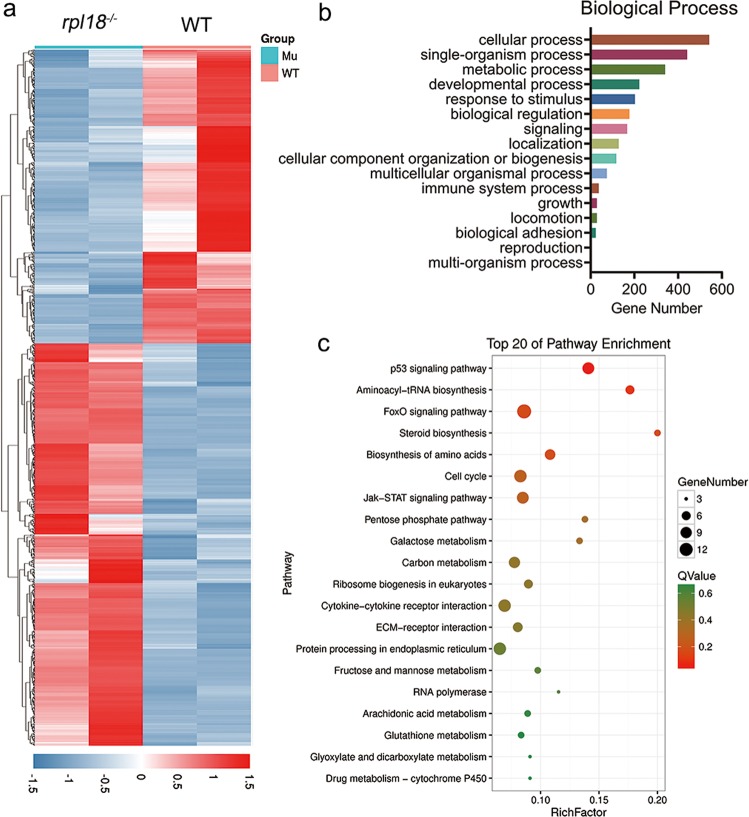
Fig. 4 Differential gene expression profile, gene ontology, and pathway enrichment analysis for <italic>rpl18</italic> mutants and siblings.

a The heat map of the differential gene expression profile for rpl18/ embryos and siblings assessed by transcriptome sequencing. b The gene ontology (GO) enrichment analysis of biological process indicated that differentially expressed genes occurred in these processes. c Pathway enrichment analysis identified the top 20 of pathway affected in mutants.

Acknowledgments
This image is the copyrighted work of the attributed author or publisher, and ZFIN has permission only to display this image to its users. Additional permissions should be obtained from the applicable author or publisher of the image. Full text @ Cell Death Dis.