
Image
|
Figure Caption
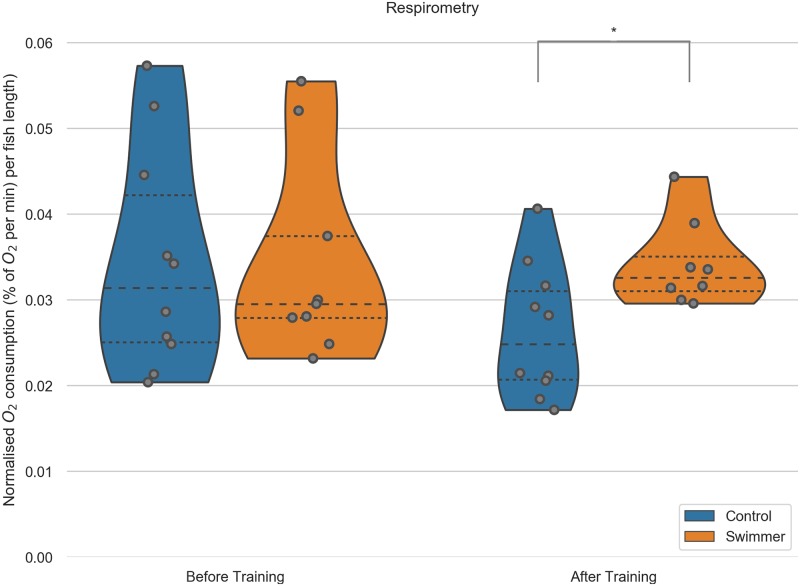
Fig 5
Each fish was measured individually in a swim tunnel respirometer before and after the 5 week training period (n = 10 for each group before training, after training n = 10 in the control group, n = 9 for swimmers). Swimmers show a significantly increased oxygen consumption compared to the untrained control group after training (p = 0.0081). **: p<0.01, lines within the plots show the quartiles of the respective distributions.
Acknowledgments
This image is the copyrighted work of the attributed author or publisher, and
ZFIN has permission only to display this image to its users.
Additional permissions should be obtained from the applicable author or publisher of the image.
Full text @ PLoS One