
Image
|
Figure Caption
Figure EV5
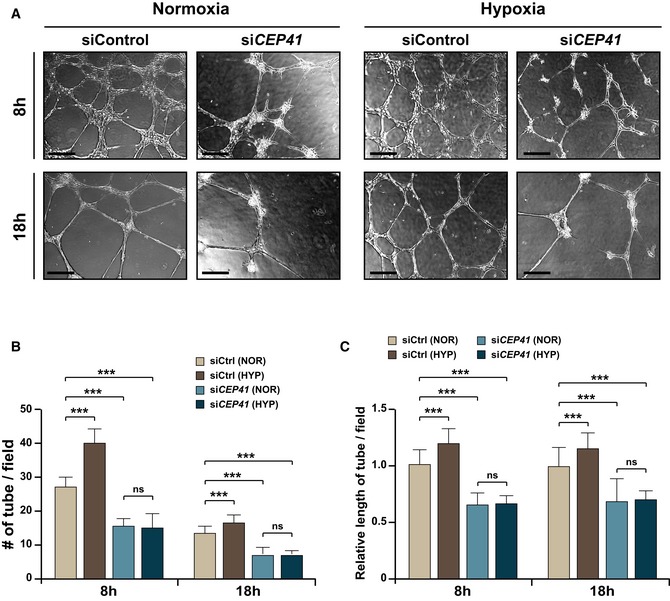
An Quantification of tube node number in (B) and tube length in (C) from data examined within equivalent fields of view at each time point using the ImageJ angiogenesis analyzer. Data are shown as mean ± SD of five independent experiments with ≥ 5 tubulogenesis regions per condition. Statistical significance was determined using the two‐way ANOVA followed by Tukey's
Acknowledgments
This image is the copyrighted work of the attributed author or publisher, and
ZFIN has permission only to display this image to its users.
Additional permissions should be obtained from the applicable author or publisher of the image.
Full text @ EMBO Rep.