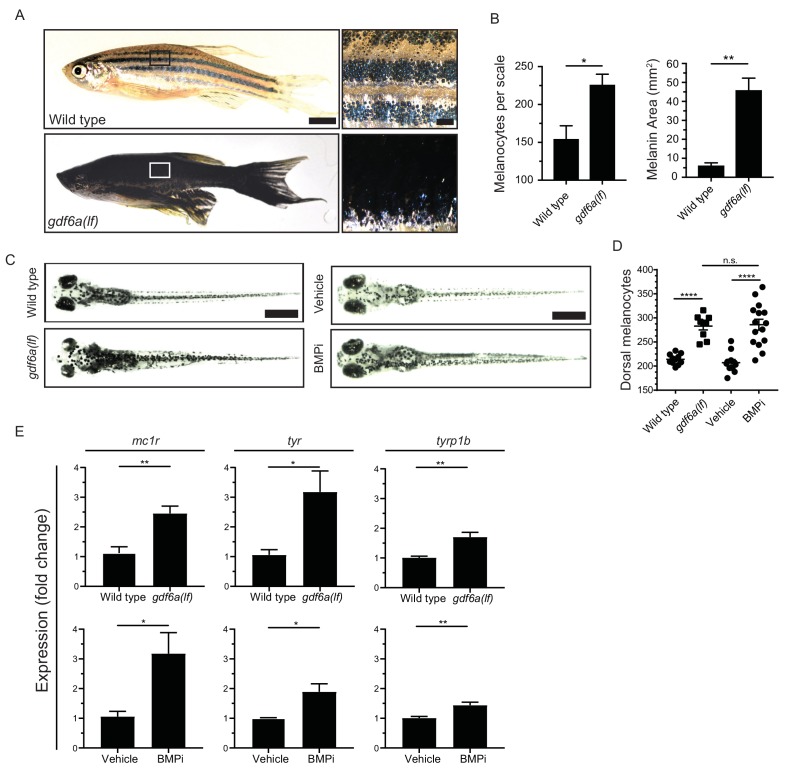
Figure 1 gdf6a loss or BMP inhibition causes the development of supernumerary melanocytes. (A) Images of wild-type and gdf6a(lf) adult zebrafish, scale bar = 4 mm, inset scale bar = 1 mm. (B) Quantification of number of melanocytes (left) and scale pigmentation using melanin coverage (right), n = 3 scales per group. (C) Wild-type and gdf6a(lf) embryos imaged at 5 days post fertilization (DPF); vehicle- and BMPi-treated embryos imaged at 5 DPF. Scale bar = 1 mm. Animals were treated with epinephrine prior to imaging. (D) Quantification of dorsal melanocytes per animal in 5 DPF wild-type, gdf6a(lf) mutant, vehicle-, and BMPi-treated embryos. n = 11, 9, 11, and 15 embryos, respectively, from two independent experiments (N = 2). (E) Expression of melanocyte differentiation markers mc1r, tyr, and tyrp1b by qRT-PCR in wild-type, gdf6a(lf) mutant, vehicle-, and BMPi-treated embryos. n = 5?6 replicates across two independent experiments (N = 2) for each group. Expression was normalized to ?-actin. Error bars represent mean + /- SEM. P-values were calculated using Student?s t-test in panel B and E, and one-way ANOVA with Tukey?s multiple comparisons test in panels D, *p<0.05, **p<0.01, ***p<0.001, ****p<0.0001, n.s., not significant.
Image
Figure Caption
Figure Data
Acknowledgments
This image is the copyrighted work of the attributed author or publisher, and
ZFIN has permission only to display this image to its users.
Additional permissions should be obtained from the applicable author or publisher of the image.
Full text @ Elife

