
Image
|
Figure Caption
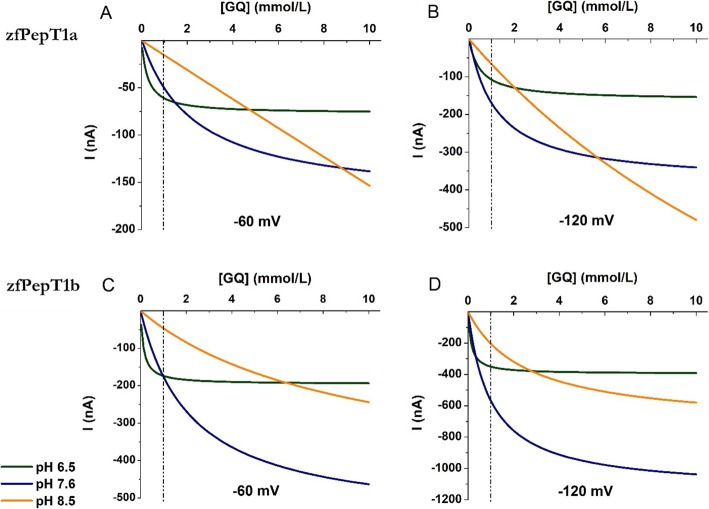
Fig. 4
Fitting of the Gly-Gln (GQ) transport-associated currents as a function of substrate concentration (from 0.01 to 10 mmol/L) at different pH (pH 6.5 in green, pH 7.6 in blue, and pH 8.5 in orange) for two different membrane potentials: − 60 mV (left) and − 120 mV (right).
Acknowledgments
This image is the copyrighted work of the attributed author or publisher, and
ZFIN has permission only to display this image to its users.
Additional permissions should be obtained from the applicable author or publisher of the image.
Full text @ Genes Nutr