IMAGE

Figure 3

ID
ZDB-IMAGE-200101-4
Source
Figures for Zhang et al., 2019
Image
Figure Caption

Figure 3

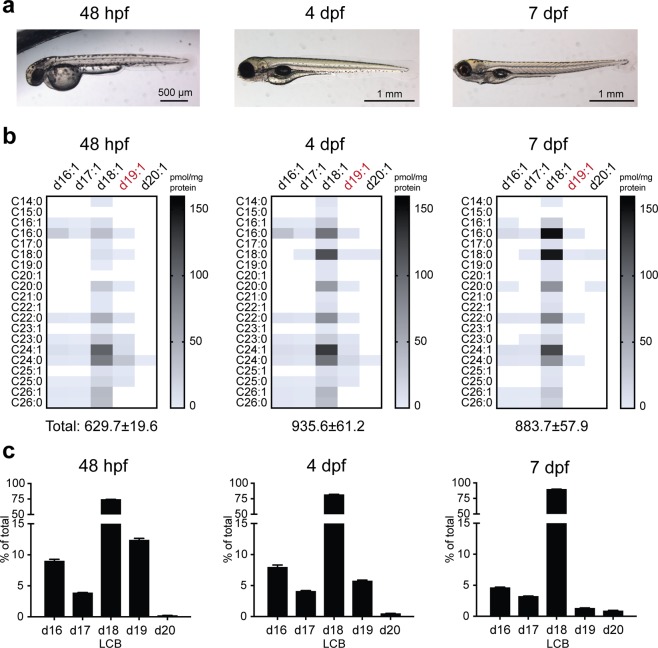
Ceramide regulation during zebrafish embryogenesis. (a) Zebrafish at 48 hpf, 4 dpf and 7 dpf. (b) Heatmap of ceramide content in 48 hpf, 4 dpf and 7 dpf larvae, demonstrating time-dependent reduction in the majority of d19:1 (highlighted in red) ceramides (see Table S3 for quantifications). (c) LCB distribution of all detected ceramides from 48 hpf, 4 dpf and 7 dpf larvae. n = 4 per group. Representative data from two independent experiments are shown. Additional verification of LCB distributions in 48 hpf embryos (n = 5 total) was performed via untargeted lipidomics (Supplemental Methods).

Acknowledgments
This image is the copyrighted work of the attributed author or publisher, and ZFIN has permission only to display this image to its users. Additional permissions should be obtained from the applicable author or publisher of the image. Full text @ Sci. Rep.