IMAGE

Fig. 7.

ID
ZDB-IMAGE-191230-588
Source
Figures for Kalasekar et al., 2019
Image
Figure Caption

Fig. 7.

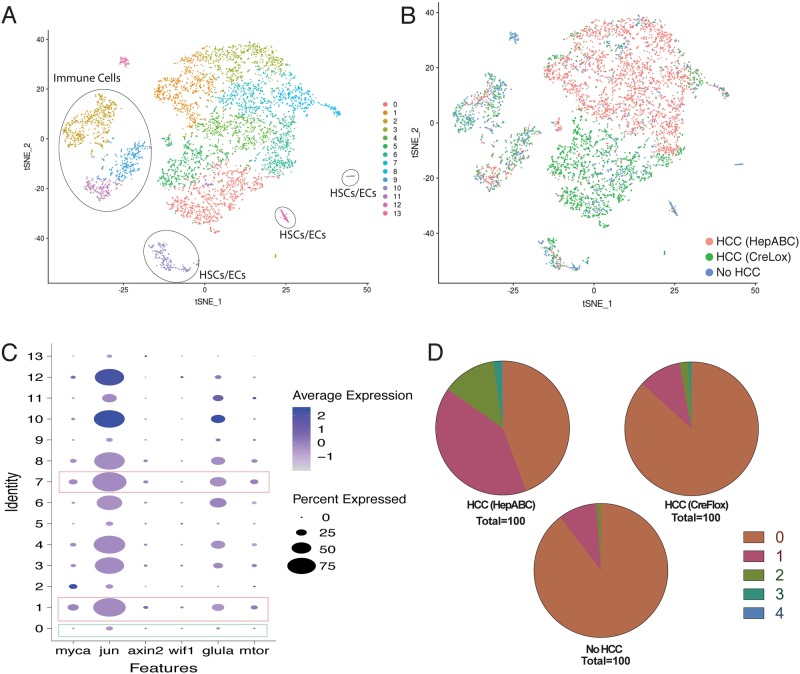
Single-cell RNA sequencing shows heterogeneous transcriptional profiles in β-catenin-driven HCC. (A) t-SNE plot of cells from all three samples [HCC from CreLox and Tg(fabp10a:pt-β-cat) zebrafish and non-HCC control liver] following multi-sample integration, color-coded by their associated cluster (0–13). Cell types of each cluster were determined based on differential expression of genes highlighted in Table S22: hepatocytes (non-circled cells), clusters 0, 1, 3, 4, 5, 6, 7, 8; immune cells, clusters 2, 9 and 11; hepatic stellate cells/endothelial cells, clusters 10 and 12; erythrocytes, cluster 13. (B) tSNE plot of multi-sample integration of cells from all three samples, color-coded by their sample of origin: Tg(fabp10a:pt-β-cat) (HepABC) HCC, pink; CreLox HCC, green; and no HCC control, blue. (C) Dot plot of β-catenin target genes differentially expressed across clusters 0–13 from A. Dot size represents the percentage of cells within the cluster that contribute to expression, and color intensity represents the average normalized level of gene expression. Pink rectangles highlight clusters with the lowest relative number of hepatocytes from non-HCC liver (clusters 1 and 7, Table S9), and green rectangles highlight clusters with the highest relative number of hepatocytes from non-HCC liver (cluster 0, Table S9). (D) Pie graphs showing the percent of hepatocytes in each liver (Table S16) that expressed 0 (brown), 1 (pink), 2 (green), 3 (teal), or 4 (blue) of Wnt/β-catenin target genes axin2, mtor, glula, myca and wif1.

Acknowledgments
This image is the copyrighted work of the attributed author or publisher, and ZFIN has permission only to display this image to its users. Additional permissions should be obtained from the applicable author or publisher of the image. Full text @ Biol. Open