Image
Figure Caption

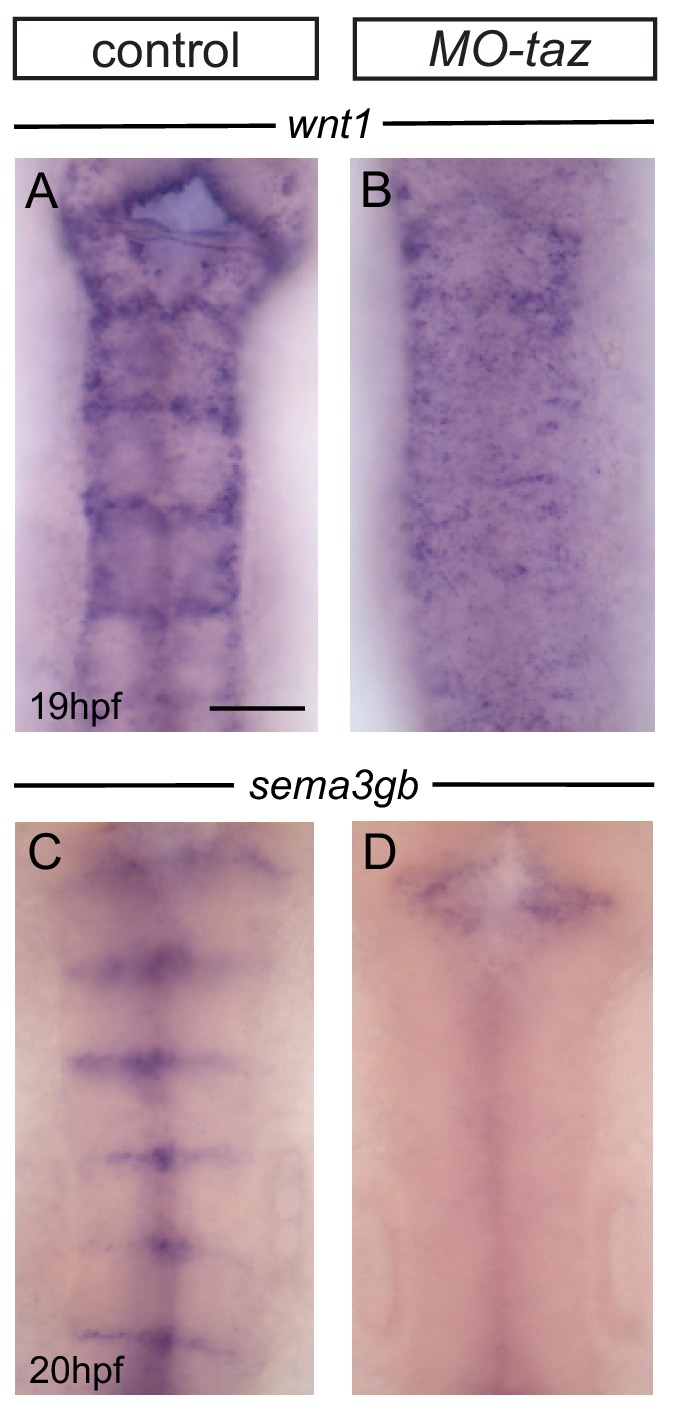
Figure 5—figure supplement 1. Boundary marker expression after <italic>taz</italic> knockdown.

(A, B) Boundary expression of wnt1 in control (A; 17/18) is no longer detected in taz knockdown embryos (B; 12/12). (C, D) Boundary expression of sema3gb in control (C; 17/17) is no longer detected in taz knockdown embryos (D; 19/19). Boundary expression of both markers is lost following taz knockdown. Dorsal views, anterior to the top. Scale bar: 50 μm.

Acknowledgments
This image is the copyrighted work of the attributed author or publisher, and ZFIN has permission only to display this image to its users. Additional permissions should be obtained from the applicable author or publisher of the image. Full text @ Elife