IMAGE

Fig. 2.

ID
ZDB-IMAGE-191230-330
Source
Figures for Wang et al., 2019
Image
Figure Caption

Fig. 2.

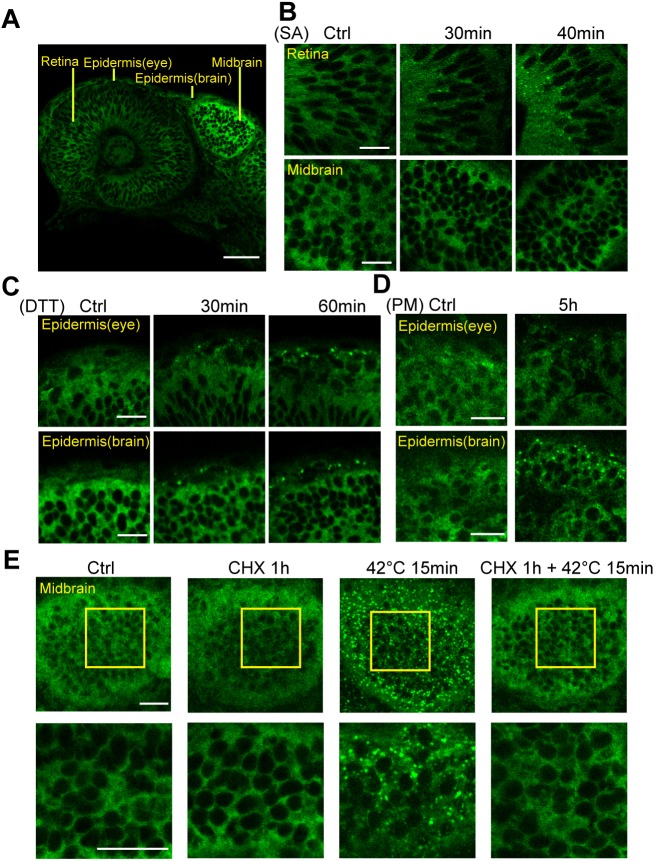
The GFP–G3BP1 reporter responds to oxidative and ER stresses in embryonic zebrafish. (A) Single-layer image showing GFP–G3BP1 expression in 1 dpf zebrafish under basal conditions. This region is examined in more detail in panels B and C. (B) Induction of stress granules in the retina, but not in the brain, of 1 dpf GFP–G3BP1 knock-in zebrafish after 30 mM sodium arsenite (SA) exposure in the medium for the indicated amount of time. (C) Induction of stress granules in epidermal cells in 1 dpf zebrafish exposed to 20 mM dithiothreitol (DTT) stress for indicated amount of time. (D) Induction of stress granules in the epidermal cells in 1 dpf zebrafish exposed to 10 mg/ml puromycin (PM) stress for 5 h. (E) Stress granule formation in midbrain was suppressed by treatment with 10 mg/ml cycloheximide (CHX). Enlarged images of the yellow square areas in the midbrain region are shown in the lower panels. Images show representative results from 2–3 independent experiments each with n=3–4 zebrafish examined at each condition. Scale bars: 20 µm.

Figure Data
Acknowledgments
This image is the copyrighted work of the attributed author or publisher, and ZFIN has permission only to display this image to its users. Additional permissions should be obtained from the applicable author or publisher of the image. Full text @ J. Cell Sci.