
Figure 8
|
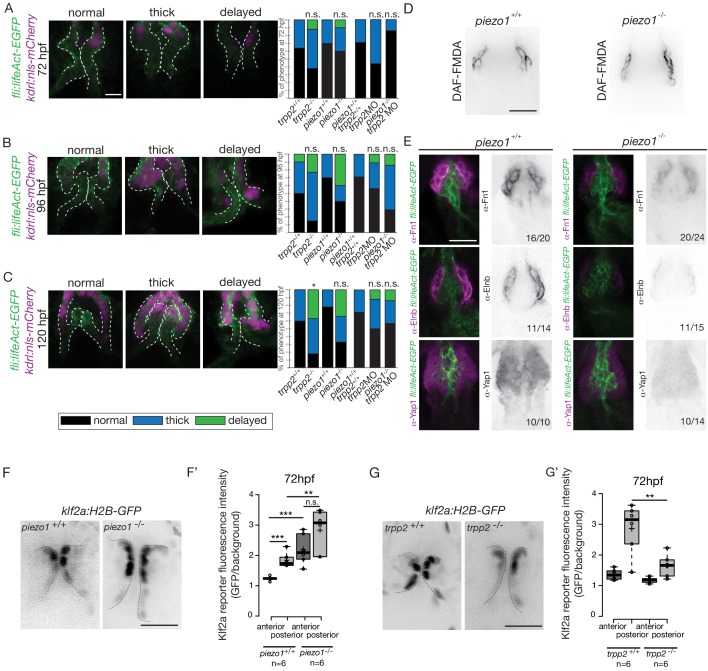
Figure 8 Flow and mechanosensitive channels are necessary for proper OFT valve formation. (A) Z-sections and quantifications of the valves phenotypes (normal, thick, delayed) of the Tg(fli:lifeaAct-EGFP; kdrl:nls-mCherry) at 72 hpf (B), 96 hpf (C) and 120 hpf (D) in trpp2+/+(n = 11, n = 10, n = 10), trpp2-/- (n = 8, n = 13, n = 13 from three independent experiments), piezo1+/+ (n = 10, n = 10, n = 9), piezo1-/-(n = 10, n = 10, n = 9 from two independent experiments), piezo1+/+; trpp2+/+ (n = 7), trpp2-morpholino injected embryos (n = 9) and piezo1-/-; trpp2-morpholino injected embryos (n = 7). Scale bar: 10 �m. (D) Z-section of the OFT stained with DAF-FMDA in piezo1+/+ and piezo1-/-. Scale bar: 20 �m. (E) Fibronectin1 (Fn1), elastin (Elnb) and Yap1 staining on Tg(fli:lifeact-eGFP) in piezo1+/+ (n = 12, n = 4 and n = 10 respectively) and piezo1-/- (n = 12, n = 4 and n = 10 respectively from three independent experiments). Scale bar: 20 �m. Z-sections (F) and quantification (F?) of the klf2a reporter (GFP over background) in the anterior and posterior parts of the valves in piezo1+/+ (n = 6) and piezo1-/- (n = 6) obtained from two independent experiments). Scale bar: 20 �m. Z-sections (G) and quantification (G?) of the klf2a reporter (GFP over background) in the anterior and posterior parts of the valves in trpp2+/+ (n = 6) and trpp2-/- (n = 6) (obtained from two independent experiments). Scale bar: 20 �m. Student?s t-test. Boxplot: Center lines show the medians; box limits indicate the 25th and 75th percentiles as determined by R software; whiskers extend 1.5 times the interquartile range from the 25th and 75th percentiles, outliers are represented by dots.