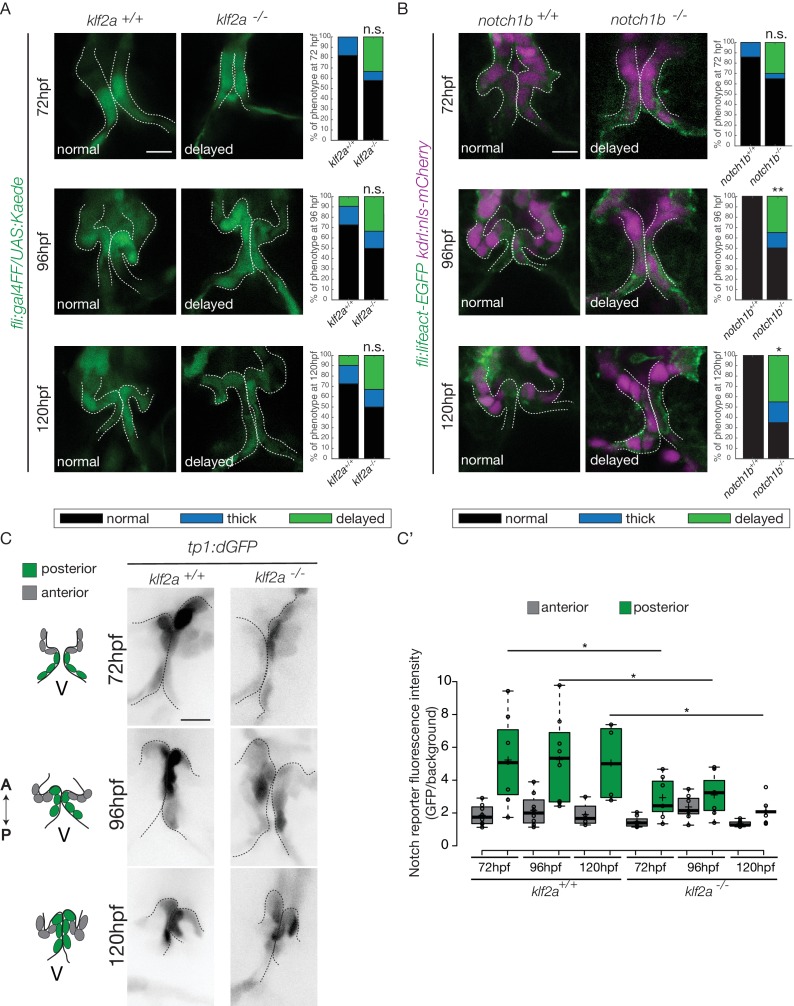
Figure 7 Klf2a and notch are necessary for valve formation. Quantification of the valve phenotypes at 72 hpf, 96 hpf and 120 hpf (normal, thick, delayed) in klf2a+/+(n = 11), and klf2a-/- (n = 12) using the Tg(fli:gal4FF/UAS:Kaede). (A) and notch1b+/+ (n = 7) and notch1b-/- (n = 20) using Tg(fli:lifeact-EGFP; kdrl:nls-mCherry) embryos. (B) Scale bar: 10 Ám. N = 3 independent experiments. (C) Confocal z-sections of the Tg(tp1:dGFP) in klf2a+/+ and klf2a-/- embryos at 72 hpf, 96 hpf and 120 hpf. V: ventricle. Scale bar: 10 Ám. (C?) Quantification of the fluorescent intensity of the Notch reporter (GFP over background) in the anterior versus posterior parts of the valves in in klf2a+/+ (n = 5) and klf2a-/- (n = 4) embryos. Statistical test were performed to compare the posterior intensities in klf2a+/+versus klf2a-/- at 72 hpf (p=0,05), 96 hpf (p=0,03) and 120 hpf (p=0,04). Student?s t-test. Boxplot: Center lines show the medians; box limits indicate the 25th and 75th percentiles as determined by R software; whiskers extend 1.5 times the interquartile range from the 25th and 75th percentiles, outliers are represented by dots. Results obtained from three independent experiments.
Image
Figure Caption
Figure Data
Acknowledgments
This image is the copyrighted work of the attributed author or publisher, and
ZFIN has permission only to display this image to its users.
Additional permissions should be obtained from the applicable author or publisher of the image.
Full text @ Elife

