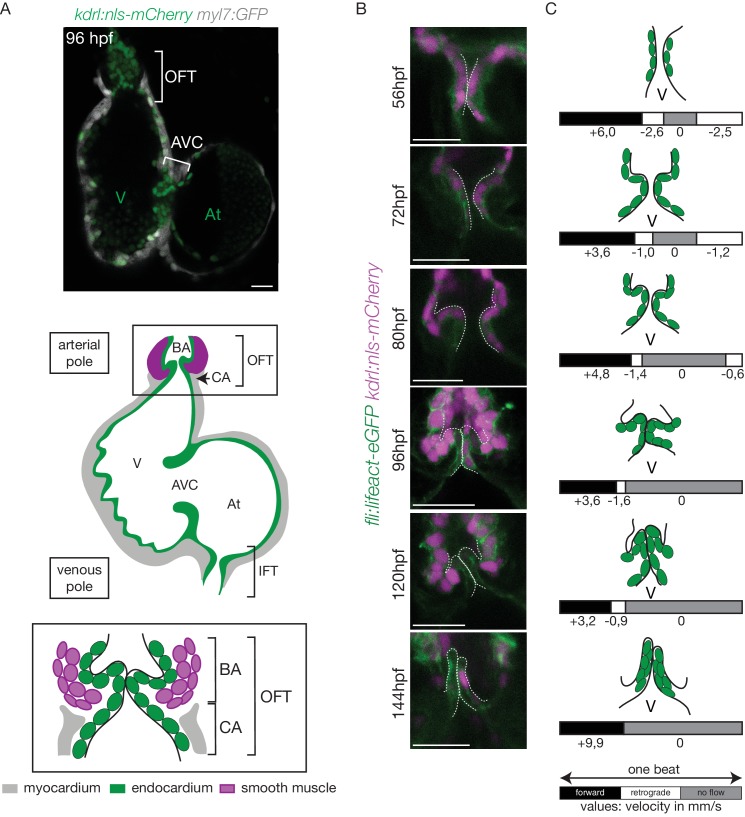
Figure 1 The OFT develops from 56 hpf to form functional valves at 144 hpf. (A) Top: Z-section of the double transgenic line Tg(kdrl:nls-mCherry; myl7:GFP) showing the overall structure of the heart. Bottom: Scheme of the zebrafish heart with the endocardium, myocardium and smooth muscles and zoom on the OFT structure. The OFT includes the CA and the BA. The CA is the zone of the myocardial connection of the ventricle to the BA. The BA is after the ventricle and is surrounded by smooth muscles. Scheme adapted from Felker et al. (2018). OFT: outflow tract, IFT: inflow tract, AVC: atrioventricular canal, At: atrium, V: ventricle, BA: bulbus arteriosus, CA: conus arteriosus. Scale bar: 20 Ám. (B) Z-sections of the double transgenic line Tg(fli:lifeact-EGFP; kdrl:nls-mCherry) at different time-points showing the endocardial OFT structure. Scale bar: 25 Ám. (C) Schematic representation summarizing the formation of the valve leaflets over time and flow profile in the OFT during development (from 56 hpf to 144 hpf) showing the forward flow (black), retrograde flow (white) and no flow (grey) fractions with the velocity of the red blood cells (in mm/s) using the double transgenic line Tg(gata1:ds-red; kdrl:EGFP). V: ventricle.
Image
Figure Caption
Figure Data
Acknowledgments
This image is the copyrighted work of the attributed author or publisher, and
ZFIN has permission only to display this image to its users.
Additional permissions should be obtained from the applicable author or publisher of the image.
Full text @ Elife

