
Image
|
Figure Caption
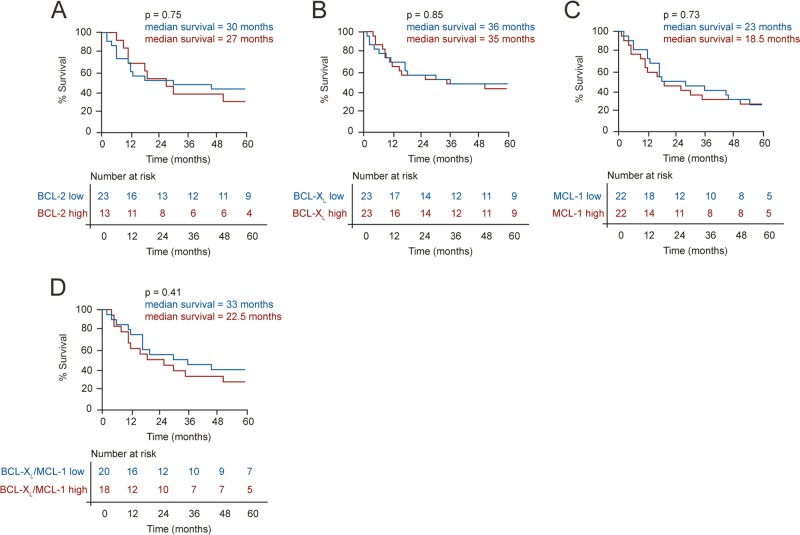
Fig. 3
Kaplan–Meier curves comparing the overall survival of patients (censored at 60 months) in the highest versus lowest quartiles for expression of
Acknowledgments
This image is the copyrighted work of the attributed author or publisher, and
ZFIN has permission only to display this image to its users.
Additional permissions should be obtained from the applicable author or publisher of the image.
Full text @ Cell Death Dis.