IMAGE

Fig. 2

ID
ZDB-IMAGE-191230-1442
Source
Figures for Carter et al., 2019
Image
Figure Caption

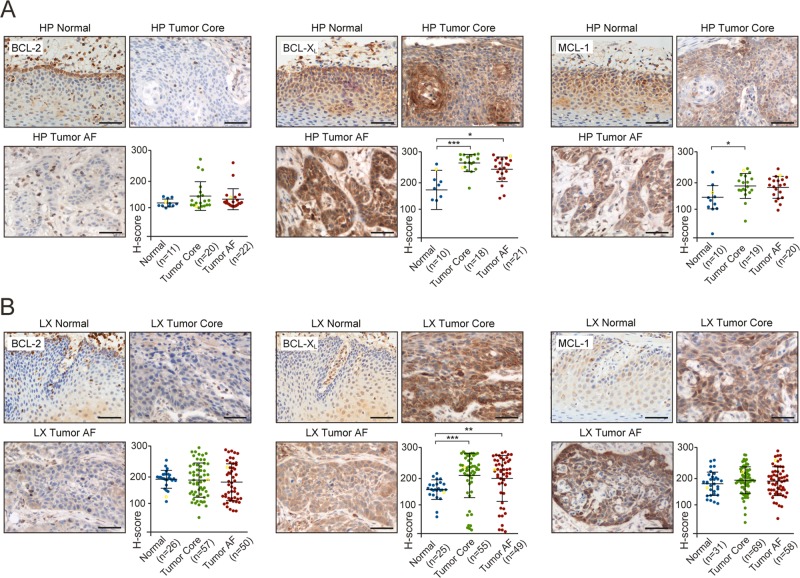
Fig. 2 BCL-X<sub>L</sub> and MCL-1 but not BCL-2 are highly expressed in hypopharynx and larynx tissue microarrays from SCCHN patients.

Representative IHC images of normal tissue, primary tumor core and advancing front (AF) from a hypopharynx (HP) and b larynx (LX) stained against the indicated antibodies and counterstained with hematoxylin. Scale bars 50 μm. The plots depict the relative staining intensities (H-score) of the specified antibody. Each dot represents the data from an individual patient. The IHC images shown correspond to the yellow dots in the graph. Normality tests were performed, followed by Kruskal Wallis tests with Dunn’s multiple comparisons tests. Error bars = mean ± SD. *P < 0.05, **P < 0.01, ***P < 0.001.

Acknowledgments
This image is the copyrighted work of the attributed author or publisher, and ZFIN has permission only to display this image to its users. Additional permissions should be obtained from the applicable author or publisher of the image. Full text @ Cell Death Dis.