IMAGE

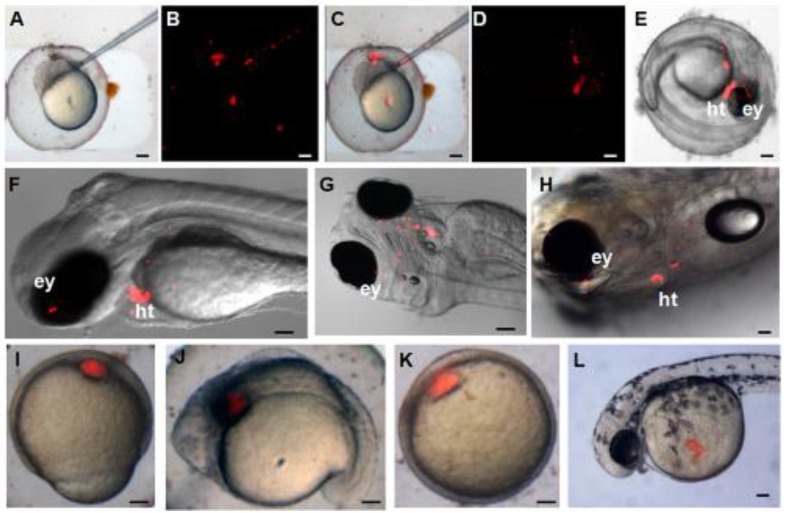
Figure 4

ID
ZDB-IMAGE-191230-1254
Source
Figures for Peng et al., 2019
Image
Figure Caption

Figure 4

Differentiation potential of zebra fish iPS-like cells in vivo. PKH26-labeled F-ziPSCs (passage 22) and PKH26-labeled zFF cells (passage 10) were transplanted with approximately 300 cells to host blastulae. The resultant chimeras were analyzed by microscopy. For the PKH26-labeled F-ziPSCs (red): (A) bright field micrograph, (B) red fluorescent micrograph, (C) merge between bright and fluorescent optical fields, and (D-H) different distributions of PKH26-labeled donor cells in different stages, in which the chimeras were analyzed by microscopy at 2 (D-G) and 5 days post-fertilization (H) (ey, eye; ht, heart). For the PKH26-labeled zFF cells (red): (I-L) the zFF cells did not migrate. The scale bars in A-E and I-L represent 200 μm and those in F-H represent 300 μm.

Acknowledgments
This image is the copyrighted work of the attributed author or publisher, and ZFIN has permission only to display this image to its users. Additional permissions should be obtained from the applicable author or publisher of the image. Full text @ Int. J. Biol. Sci.