Fig. 4
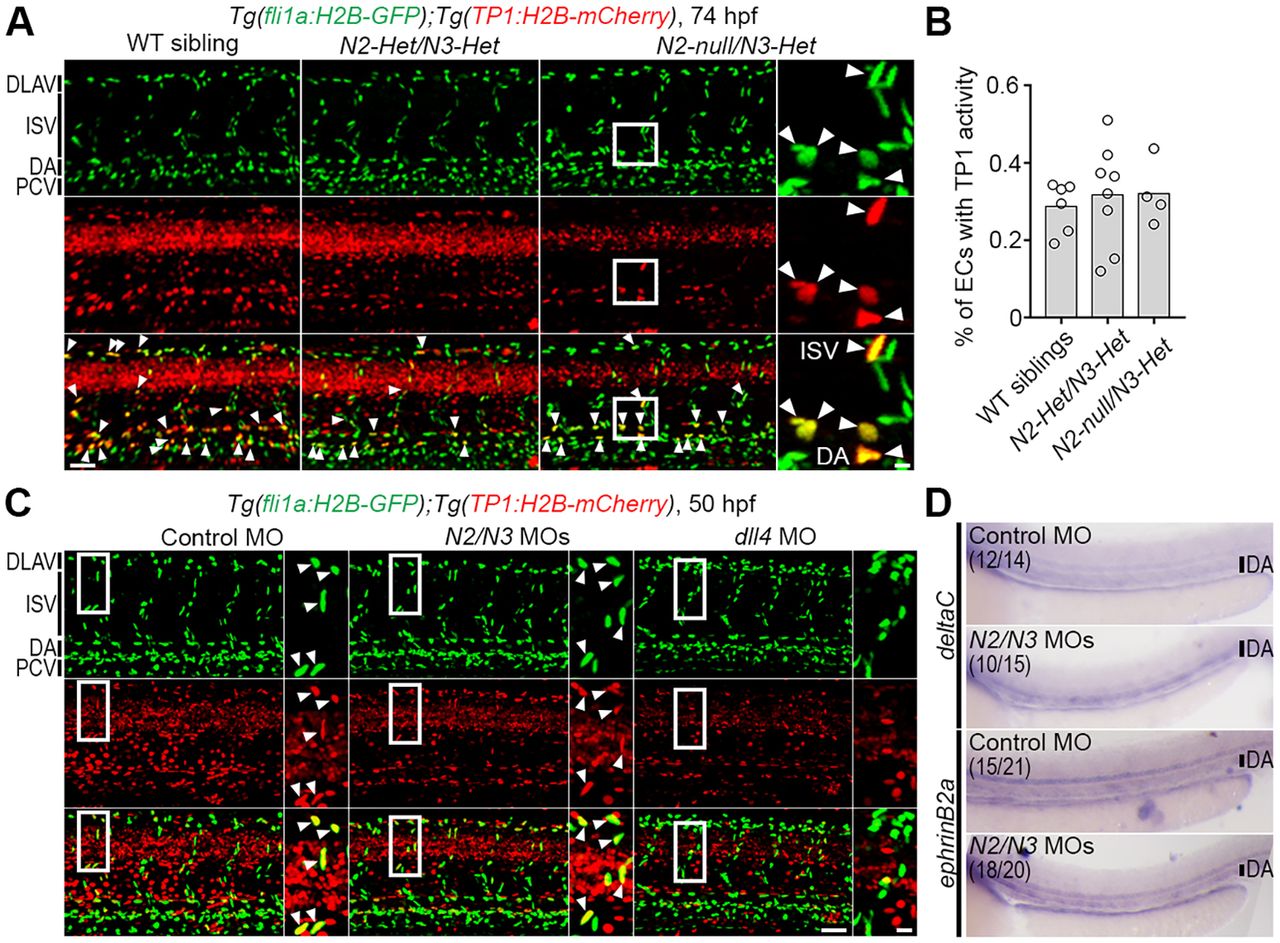
Depletion of both notch2 and notch3 hardly affected Notch-Rbpj-mediated transcriptional activity in ECs. (A) Confocal stack images of the trunk vasculature of the wild-type (WT) sibling or notch2/notch3 mutants with the Tg(fli1a:H2B-GFP);Tg(TP1:H2B-mCherry) background at 74 hpf. (B) The percentage of ECs in observed trunk region with TP1:H2B-mCherry expression, as observed in A. Total number of EC nuclei marked by fli1a:H2B-GFP and the number of EC nuclei positive for both fli1a:H2B-GFP and TP1:H2B-mCherry were counted using Imaris software. Bars and circles indicate averages and each value of observed larvae, respectively. (C) Confocal images of trunk vasculature of the 50 hpf Tg(fli1a:H2B-GFP);Tg(TP1:H2B-mCherry) embryos injected with 10 ng control MO (left), 5 ng each of notch2 and notch3 MOs (middle, N2/N3 MOs) or 10 ng of dll4 MO (right). (D) The expression of deltaC or ephrin-B2a mRNA, as detected by whole-mount in situ hybridization, in 48 hpf embryos injected with 10 ng control MO or 5 ng each of notch2 and notch3 MOs. Numbers indicate embryos with the similar expression as shown in each image/total number of embryos. Two independent experiments were performed for each marker with at least seven embryos per experiment. In A and C, arrowheads indicate ECs with TP1:H2B-mCherry expression; boxed regions are enlarged to the right. Scale bars: 50 µm; 10 µm in enlarged images. DLAV, dorsal longitudinal anastomotic vessels; PCV, posterior cardinal vein.

