
|
Fig. S5
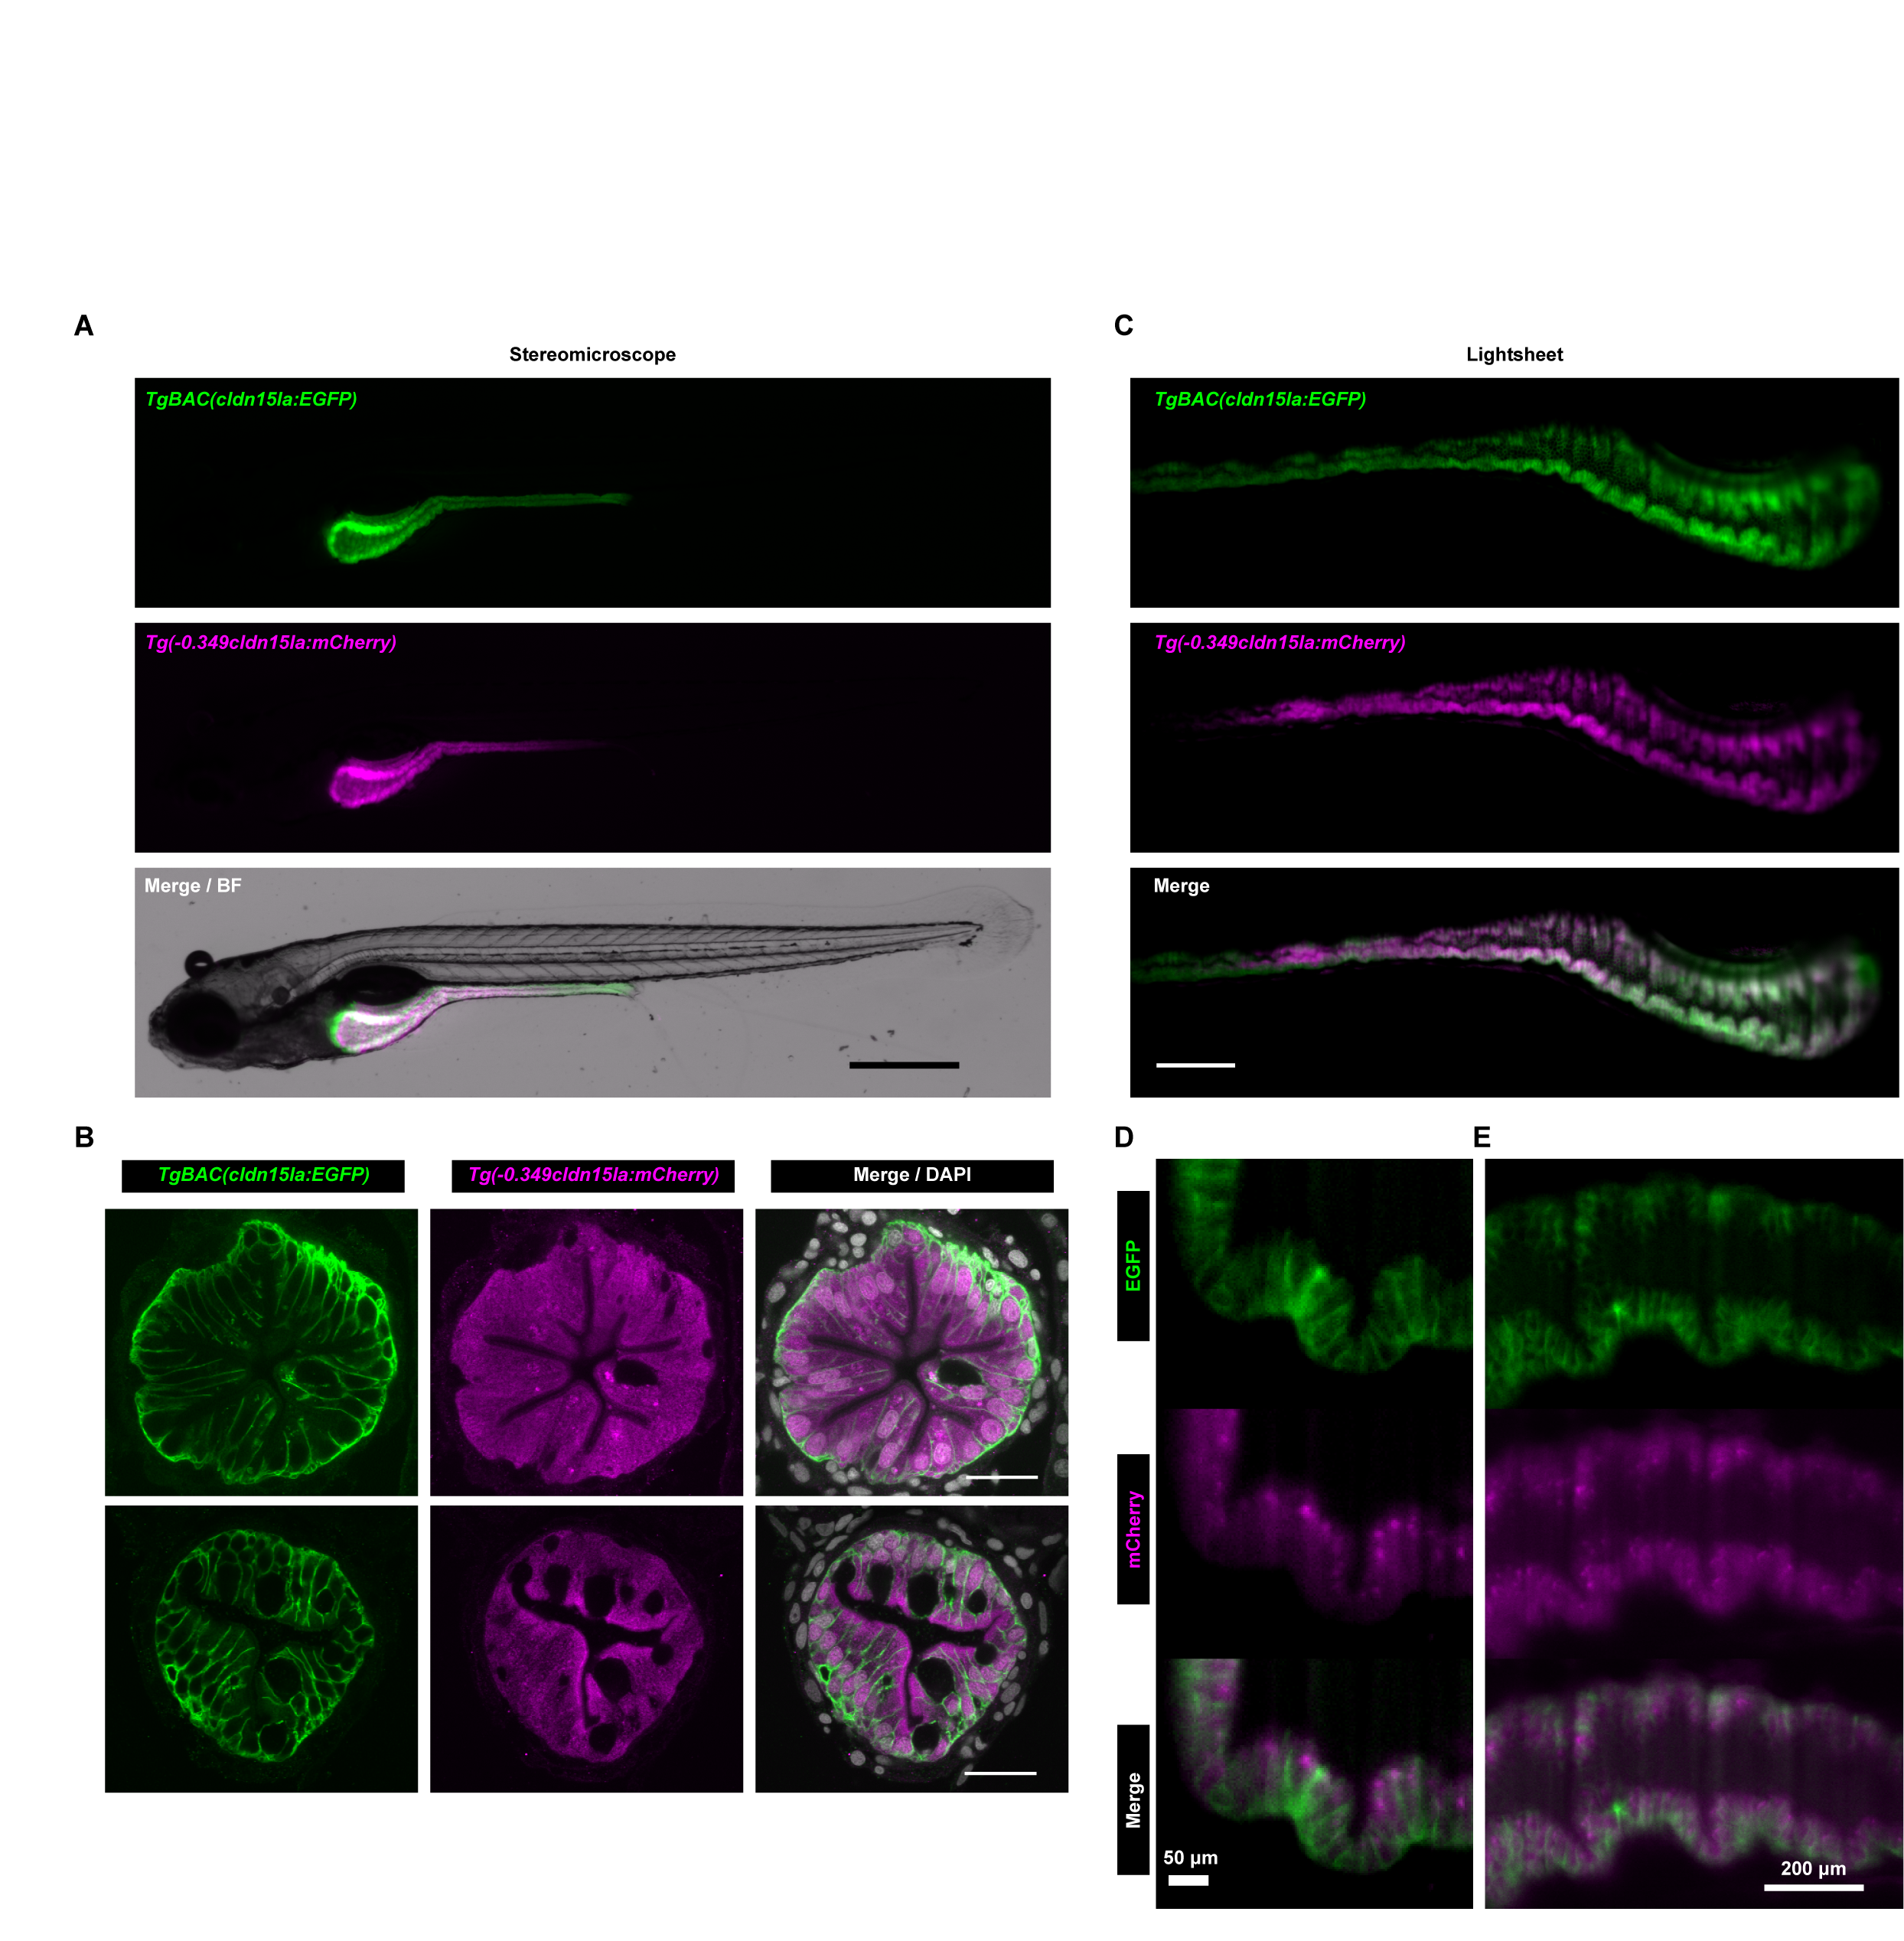
Comparison of Tg(-0.349cldn15la:mCherry) and TgBAC(cldn15la:EGFP)expression patterns.
(A) Widefield fluorescence images of IEC-specific cytosolic mCherry expression in 6 dpf double transgenic Tg(-0.349cldn15la:mCherry)rdu65; TgBAC(cldn15la:EGFP)pd1034Tg larvae demonstrated overlap in mCherry and GFP expression domains (scale bar = 500 μm). (B)Representative confocal micrographs of immunolabeled transverse sections from anterior (upper) and posterior (lower) intestinal segments of Tg(-0.349cldn15la:mCherry)rdu65;TgBAC(cldn15la:EGFP)pd1034Tg 6 dpf larvae revealed expression of both mCherry and EGFP in IECs (scale bar = 20 μm). (C) Representative maximum intensity projections from single plane illumination microscopy (SPIM) z-stacks of Tg(-0.349cldn15la:mCherry)rdu65;TgBAC(cldn15la:EGFP) pd1034Tg 6 dpf larvae (scale bar = 500 μm). (D-E) High magnification single slice lightsheet images of the intestinal epithelium in a representative 6 dpf Tg(-0.349cldn15la:mCherry)rdu65;TgBAC(cldn15la:EGFP) pd1034Tg larva.