
|
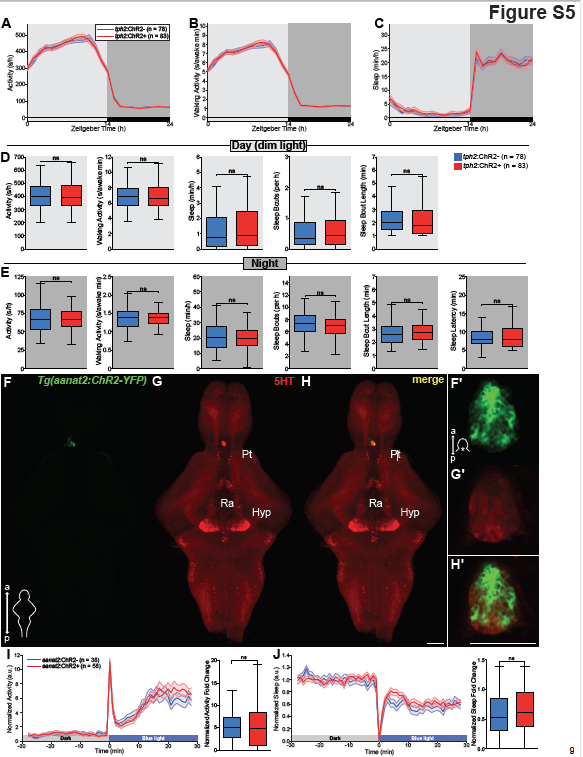
Fig. S5
Tg(tph2:ChR2-YFP) zebrafish show normal wake/sleep cycles when maintained in dim light/dark cycles; blue light exposure does not affect behavior in zebrafish that express ChR2 in the pineal gland, related to Figure 4. (A-C) Activity (A), waking activity (B), and sleep (C) for Tg(tph2:ChR2-eGFP) (red) and non-transgenic siblingcontrol (blue) zebrafish maintained in a dim light/dark cycle. Line and shading represent mean ± s.e.m. n = number of animals. (D and E) Boxplots quantifying activity, waking activity, sleep, sleep bout number, sleep bout length during day (D) and night (E) and sleep latency during night (E). n = number of animals. ns p>0.05, Mann-Whitney test. (F-H’) Maximum intensity projections of dissected brains from 5 dpf Tg(aanat2:ChR2-YFP) zebrafish immunostained for 5-HT and YFP. a, anterior; p, posterior; Pt, pretectal area; Hyp, hypothalamus; Ra, raphe. The 5-HT+ structure above the Pt is the remnants of the pineal gland that was damaged during dissection. (F’- H’) Single plane images of the pineal gland from 5 dpf Tg(aanat2:ChR2-YFP) whole zebrafish immunostained for 5-HT and YFP. Scale bars, 50 μm. (I, J) Left: Normalized locomotor activity (I) and sleep (J) traces of 5 dpf Tg(aanat2:ChR2) zebrafish (red) and non-transgenic siblings (blue) before and during exposure to blue light. Right: boxplots quantifying normalized locomotor activity (I) and sleep (J) fold change during illumination. Line and shading represent mean ± s.e.m. n = number of animals; 3 trials per animal. ns p>0.05, Mann-Whitney test.