
|
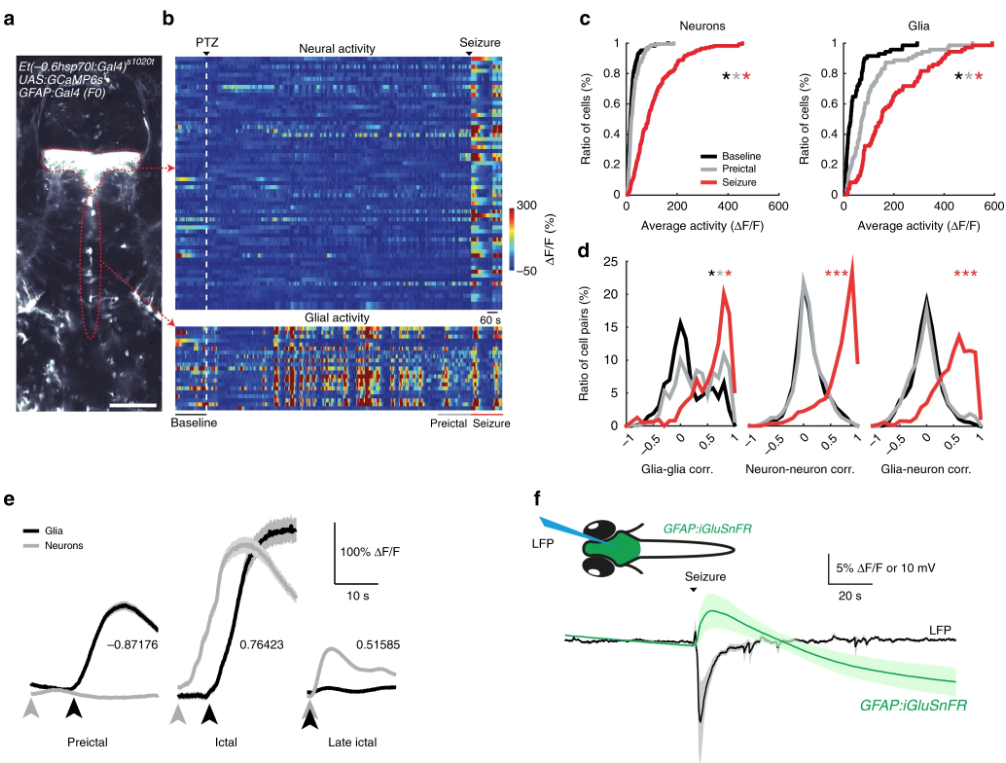
Fig. 5
Functional interactions between glia and neurons change drastically during seizure generation. a An optical section of a transgenic zebrafish larva expressing GCaMP6s in thalamic neurons (top red dotted line) and GFAP expressing glial cells near the ventricles (bottom red dotted line) obtained by two-photon microscopy, dorsal view. White bar reflects 100 µm. b Activity (ΔF/F) of individual thalamic neurons (top) and glial cells along the ventricle (bottom). White dashed line indicates the start of 20 mM pentylenetetrazole (PTZ) perfusion. Warmer colors indicate stronger activity. c Cumulative distribution of neural (left) and glial activity (right) during baseline (black), preictal (gray) and seizure (red) periods, n = 71 glial cells and n = 171 neurons across four fish. d Histograms representing the distribution of all pairwise Pearson’s correlations for the activity of glia-glia pairs (left), neuron-neuron pairs (middle) and glia-neuron pairs (right). e Temporal relationship between average activity bursts of glia (black) and neurons (gray) during preictal and ictal state. Average Pearson’s correlation values between glial and neural activity bursts are indicated. f Scheme representing simultaneous local field potential (LFP) recording and epifluorescence imaging of a transgenic zebrafish larva expressing the glutamate sensor iGluSnFR (upper). The lower graph shows the average local field potential signals (black), and the average fluorescence intensity change (ΔF/F) for iGluSnFRsignals (green). Signals from multiple fish aligned at the onset of generalized seizure, n = 7 fish. ***p = < 0.001, *p = < 0.05, ns = not significant, Wilcoxon rank-sum test. Shaded regions denote se.m. of n = 4 fish (d, e) and n = 7 fish (f)