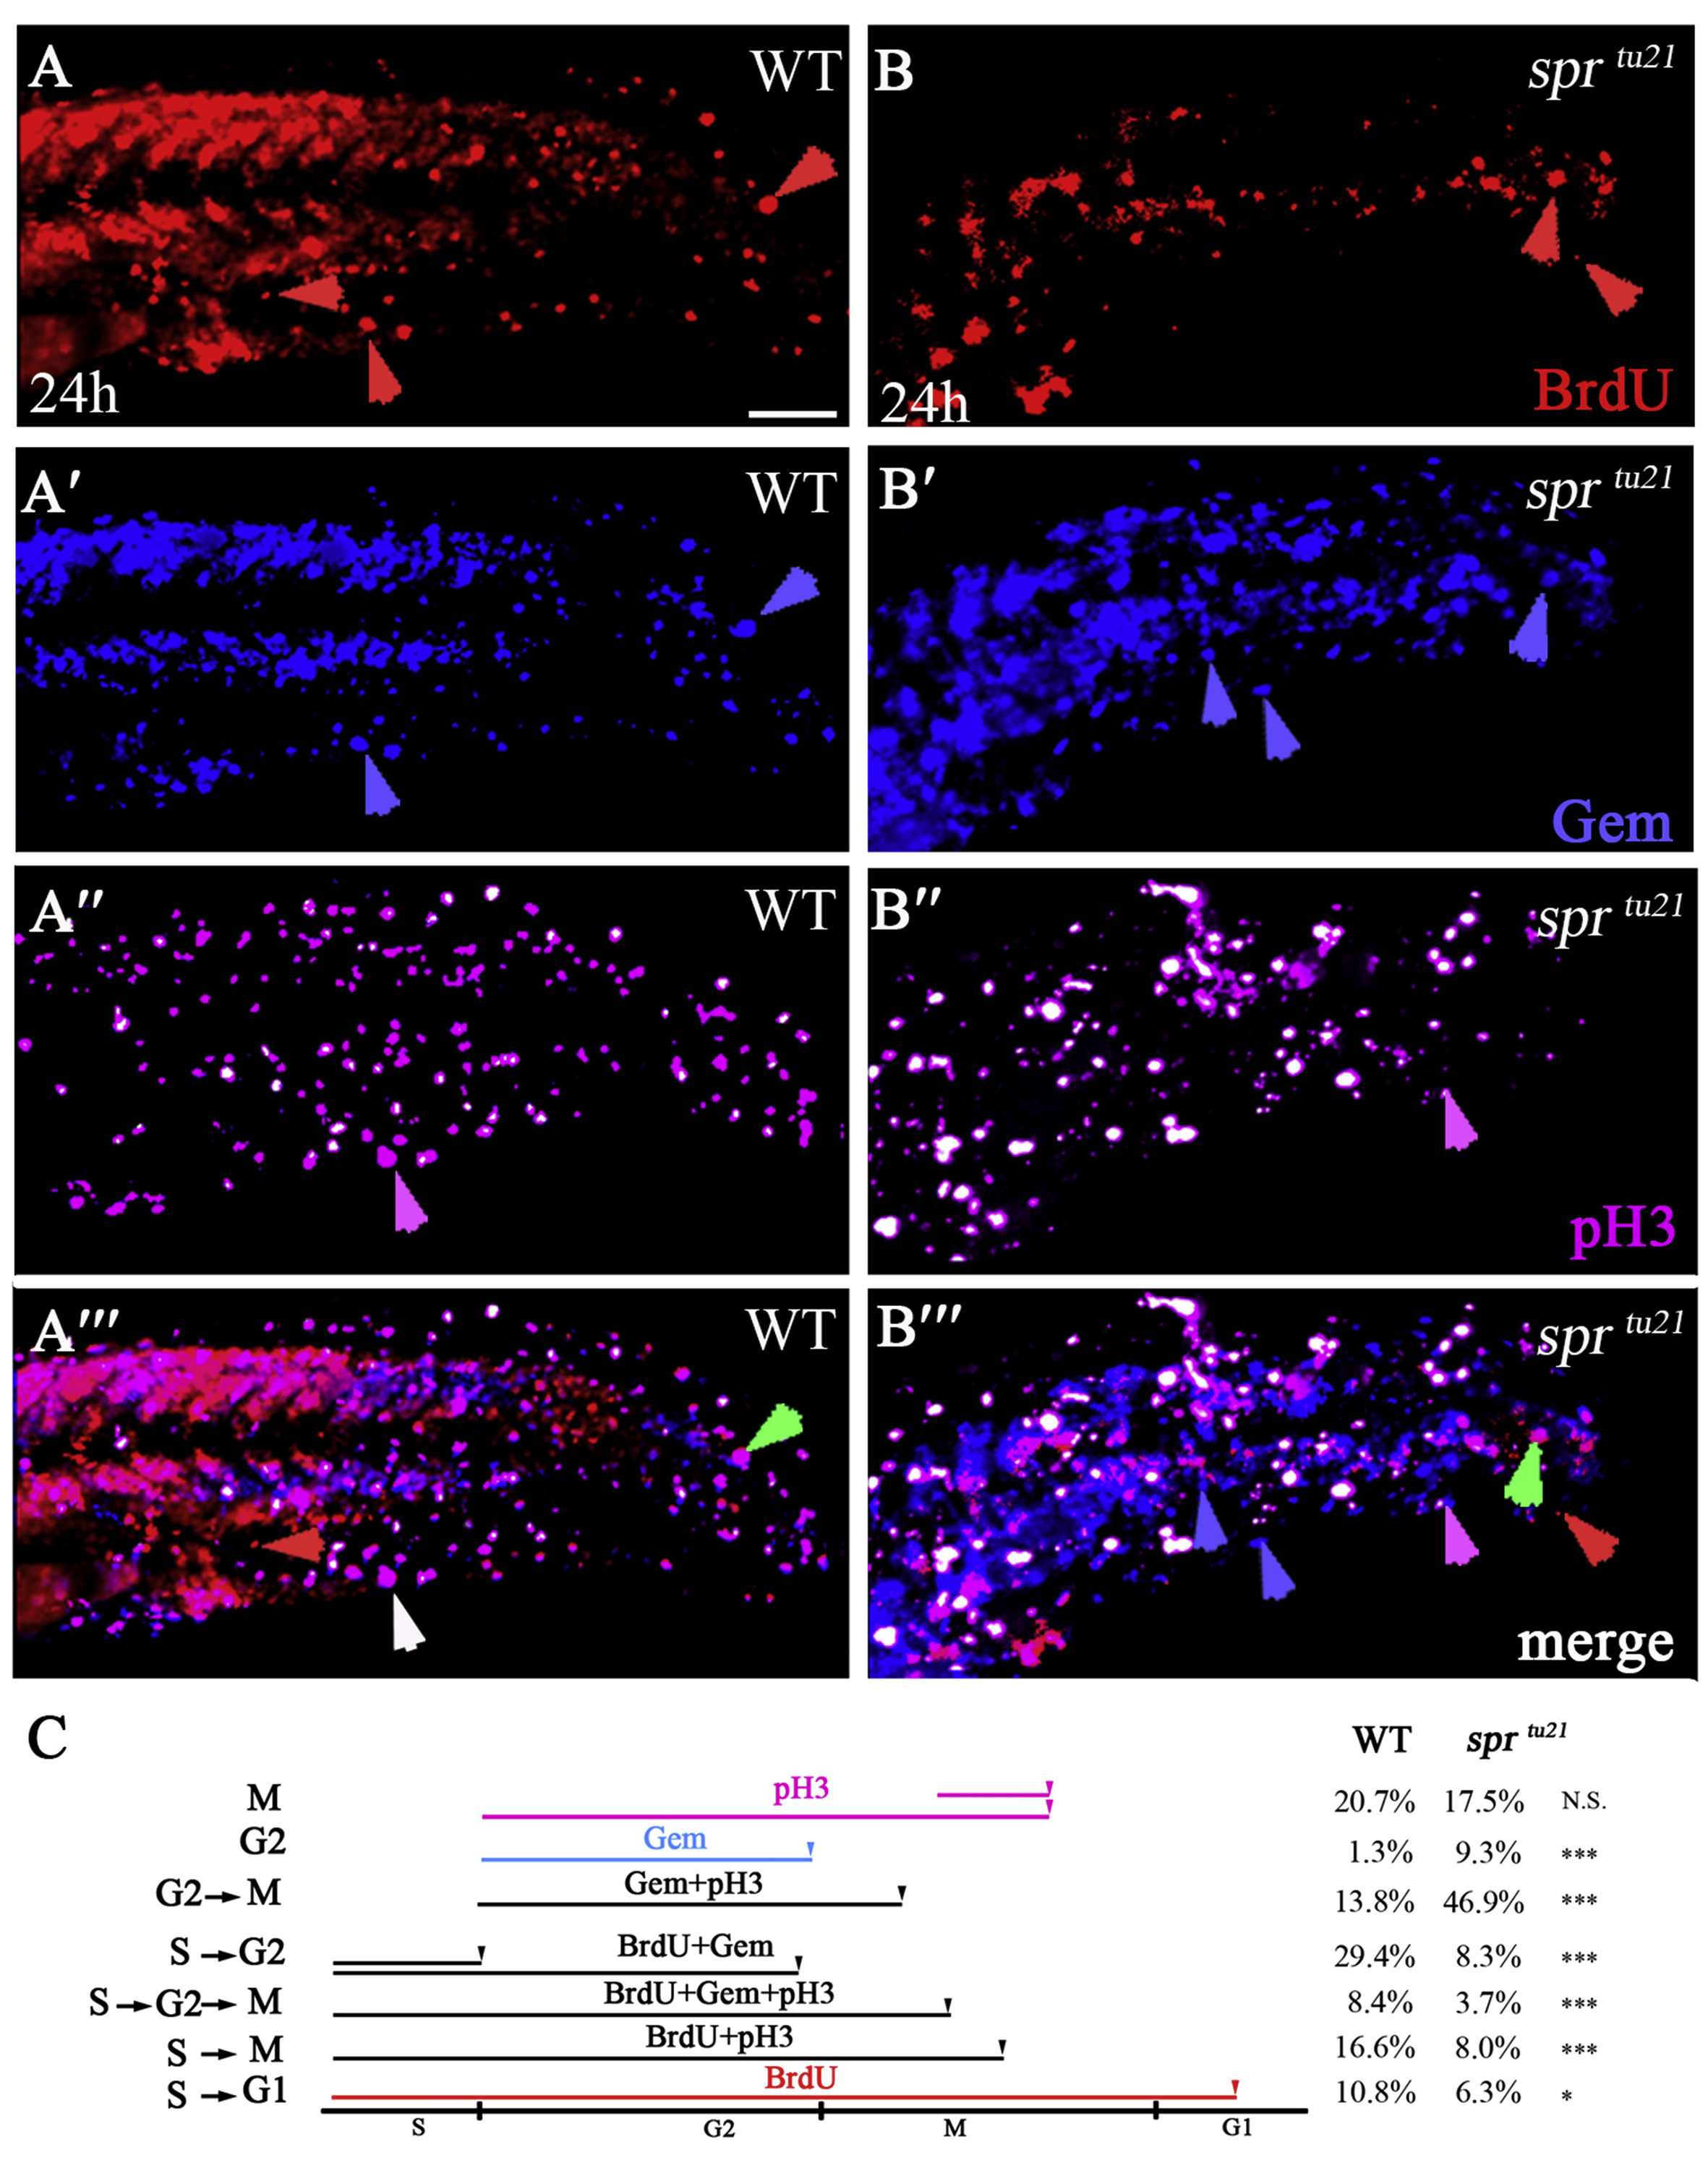
Fig. 7
sprtu21 mutant cells spend longer time in G2 and M phases. (A-B?) The same cells in wild type (A-A?) and mutant (B-B?) visualized with different markers to distinguish between the stages of the cell cycle at 24 h. Embryos were labeled for 1 hour with BrdU and then fixed and stained for: anti-BrdU to visualize cells in the S-phase (A, B); anti-GFP to visualize Cerulean-Geminin cells in S/G2/early M phase (A′-B′); and anti-pH3 antibody to visualize cells in mitosis (A″, B″); or the merge (A?, B?). Symbols are: red arrows, cells that have gone through a full cell cycle and reside in G1 phase; green arrows, cells that have entered S phase; white arrows, cells that have gone through the S phase and entered mitosis; pink arrows, cells that have entered M phase but did not go through S phase; blue arrows, cells that have entered in the G2/early M phase. Scare bar is 50?μm. (C) Quantification of cells in a specific phase of the cell cycle from the data above.
Reprinted from Developmental Biology, 451(2), Petrachkova, T., Wortinger, L.A., Bard, A.J., Singh, J., Warga, R.M., Kane, D.A., Lack of Cyclin B1 in zebrafish causes lengthening of G2 and M phases, 167-179, Copyright (2019) with permission from Elsevier. Full text @ Dev. Biol.

