Fig. 1
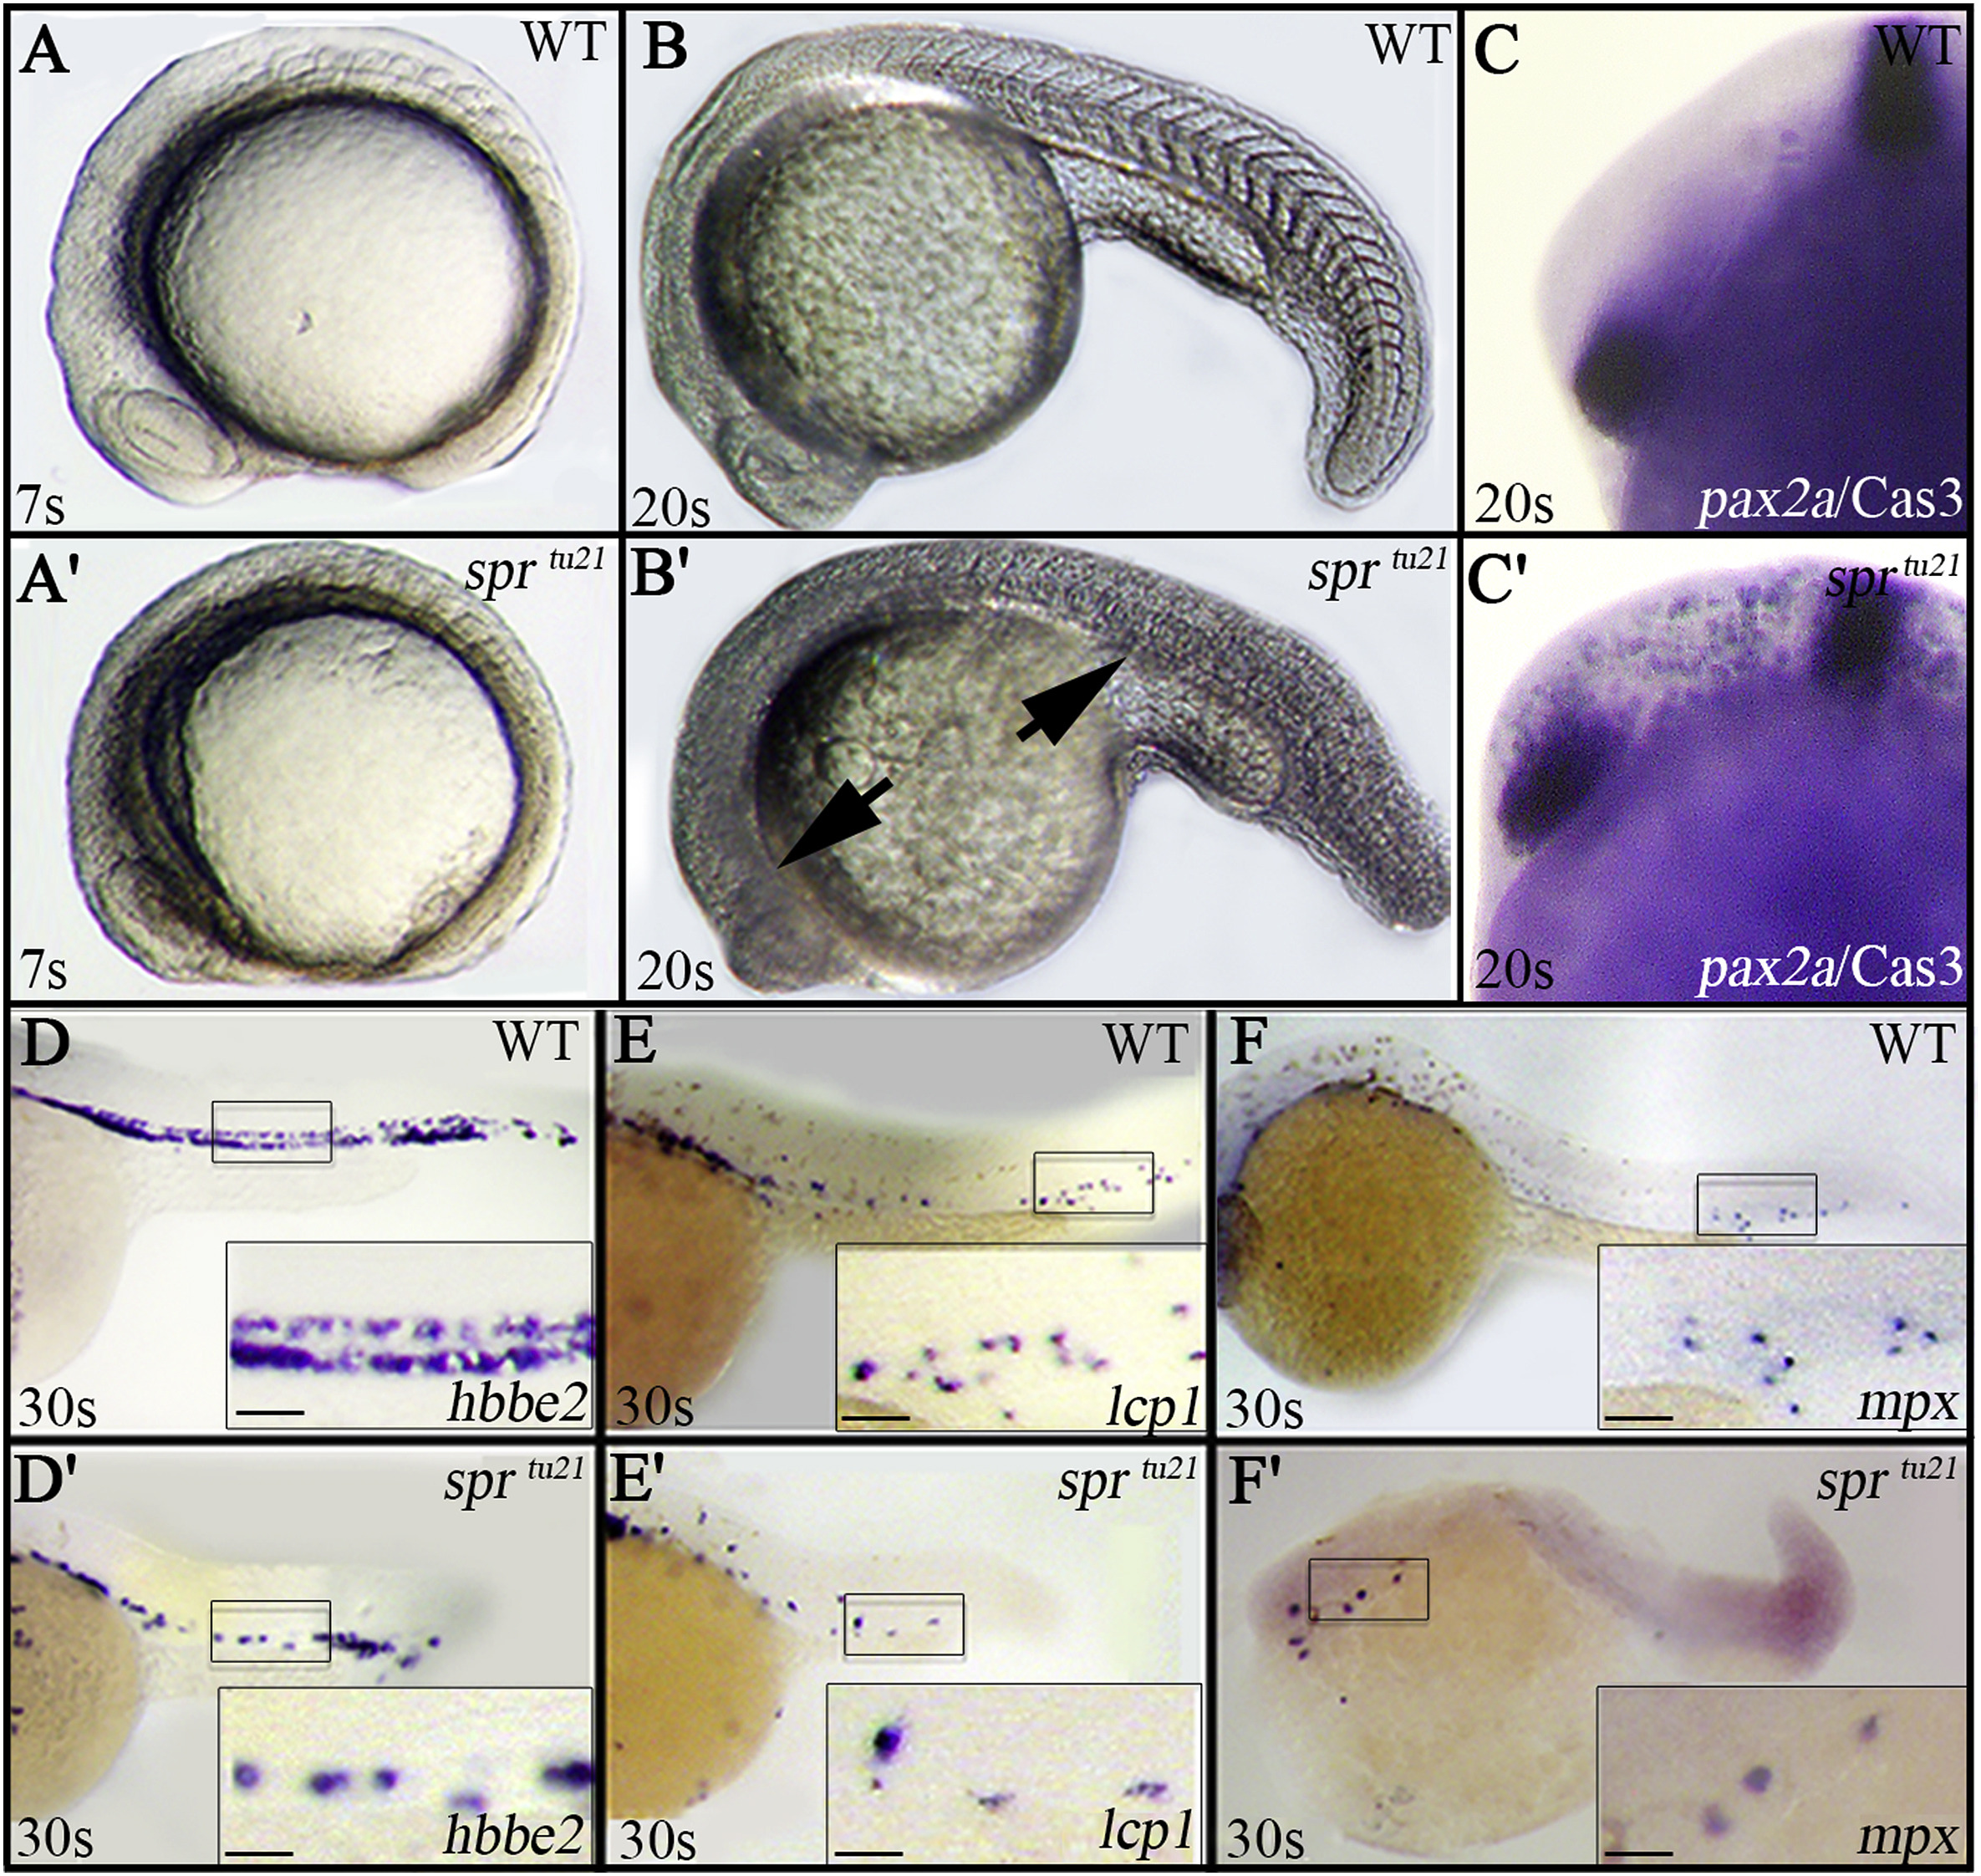
The spr mutant phenotype. (A, B) Morphology of the live embryo, side view of: (A, B) wild-type and (A′, B′) sprtu21 embryos. Arrows indicate darkening in the head and trunk. Note the undefined somiteborders in the mutant by 20-somites (19 h). (C, C′) Apoptosis, visualized by antibody staining for an active form of Caspase 3, is evident in the head of the spr mutant by 25-somites (21.5 h). Embryos are shown in side view using pax2a mRNA expression to define the area between the hindbrain and optic stalk. (D-F′) Blood cells are larger and less frequent in the spr mutant. (D, D′) Labeling of the blood by the erythrocyte marker, hbbe2 (Brownlie et al., 1998), 8/8 mutants and 20/20 wild-type embryos displayed this phenotype; (E, E′) the macrophage marker, lcp1 (Herbomel et al., 1999), 10/10 mutants and 17/17 wild-type embryos displayed this phenotype; (F, F′); and the neutrophil marker, mpx (Bennett et al., 2001; Lieschke et al., 2001), 10/10 mutants and 21/21 wild-type embryos displayed this phenotype. Boxes indicate the areas enlarged at higher magnification, scale bar is 20?μm.
Reprinted from Developmental Biology, 451(2), Petrachkova, T., Wortinger, L.A., Bard, A.J., Singh, J., Warga, R.M., Kane, D.A., Lack of Cyclin B1 in zebrafish causes lengthening of G2 and M phases, 167-179, Copyright (2019) with permission from Elsevier. Full text @ Dev. Biol.

