
|
Fig. S5
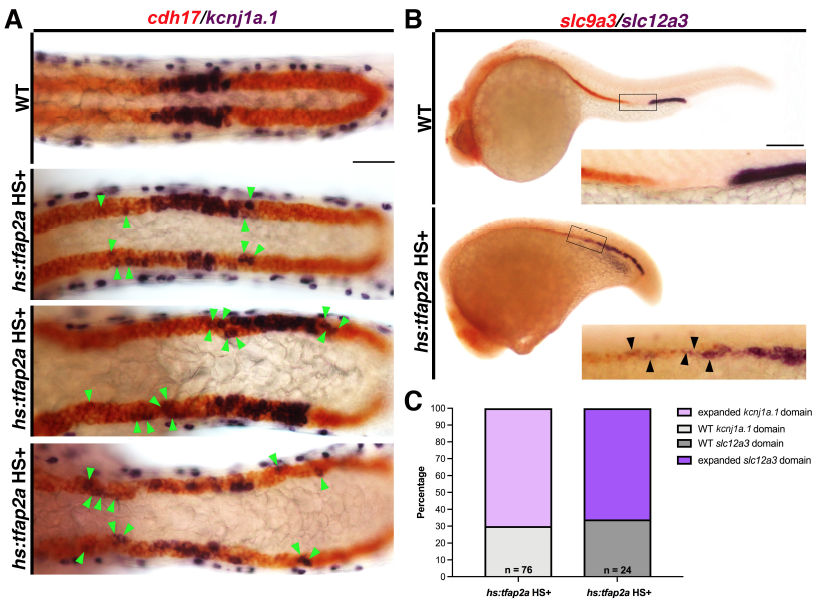
Global overexpression of tfap2a expands kcnj1a.1 and slc12a3 distal tubule markers within the pronephros. A. WISH indicated markers. WT and three different hs:tfap2a underwent heat-shock treatment at 8ss and were fixed at 24 hpf. Green arrowheads label kcnj1a.1+ cells expanding in either the proximal or distal direction upon tfap2a overexpression. Scale bar = 35 μm. B. WISH to assay for slc9a3 (red, pan proximal) and slc12a3 (purple, distal late) expression in 24 hpf WT and hs:tfap2a animals subjected to heat-shock at the 8ss. Black box indicates region highlighted by inset. Black arrowheads identify individual distal slc12a3+ cells invading the slc9a3+ pan proximal domain. Scale bar = 150 μm C. Penetrance graph illustrating percentage of hs:tfap2a embryos (treated with heat-shock at the 8ss) that exhibit normal or expanded kcnj1a.1 (light purple) and slc12a3 (dark purple) phenotypes. n = 76 samples were scored for changes in kcnj1a.1 expression, and n = 24 samples were scored for changes in slc12a3 expression. Grey indicates hs:tfap2a animals counted that did not exhibit expanded distal marker phenotypes.